
ACT 1: The Starting Point
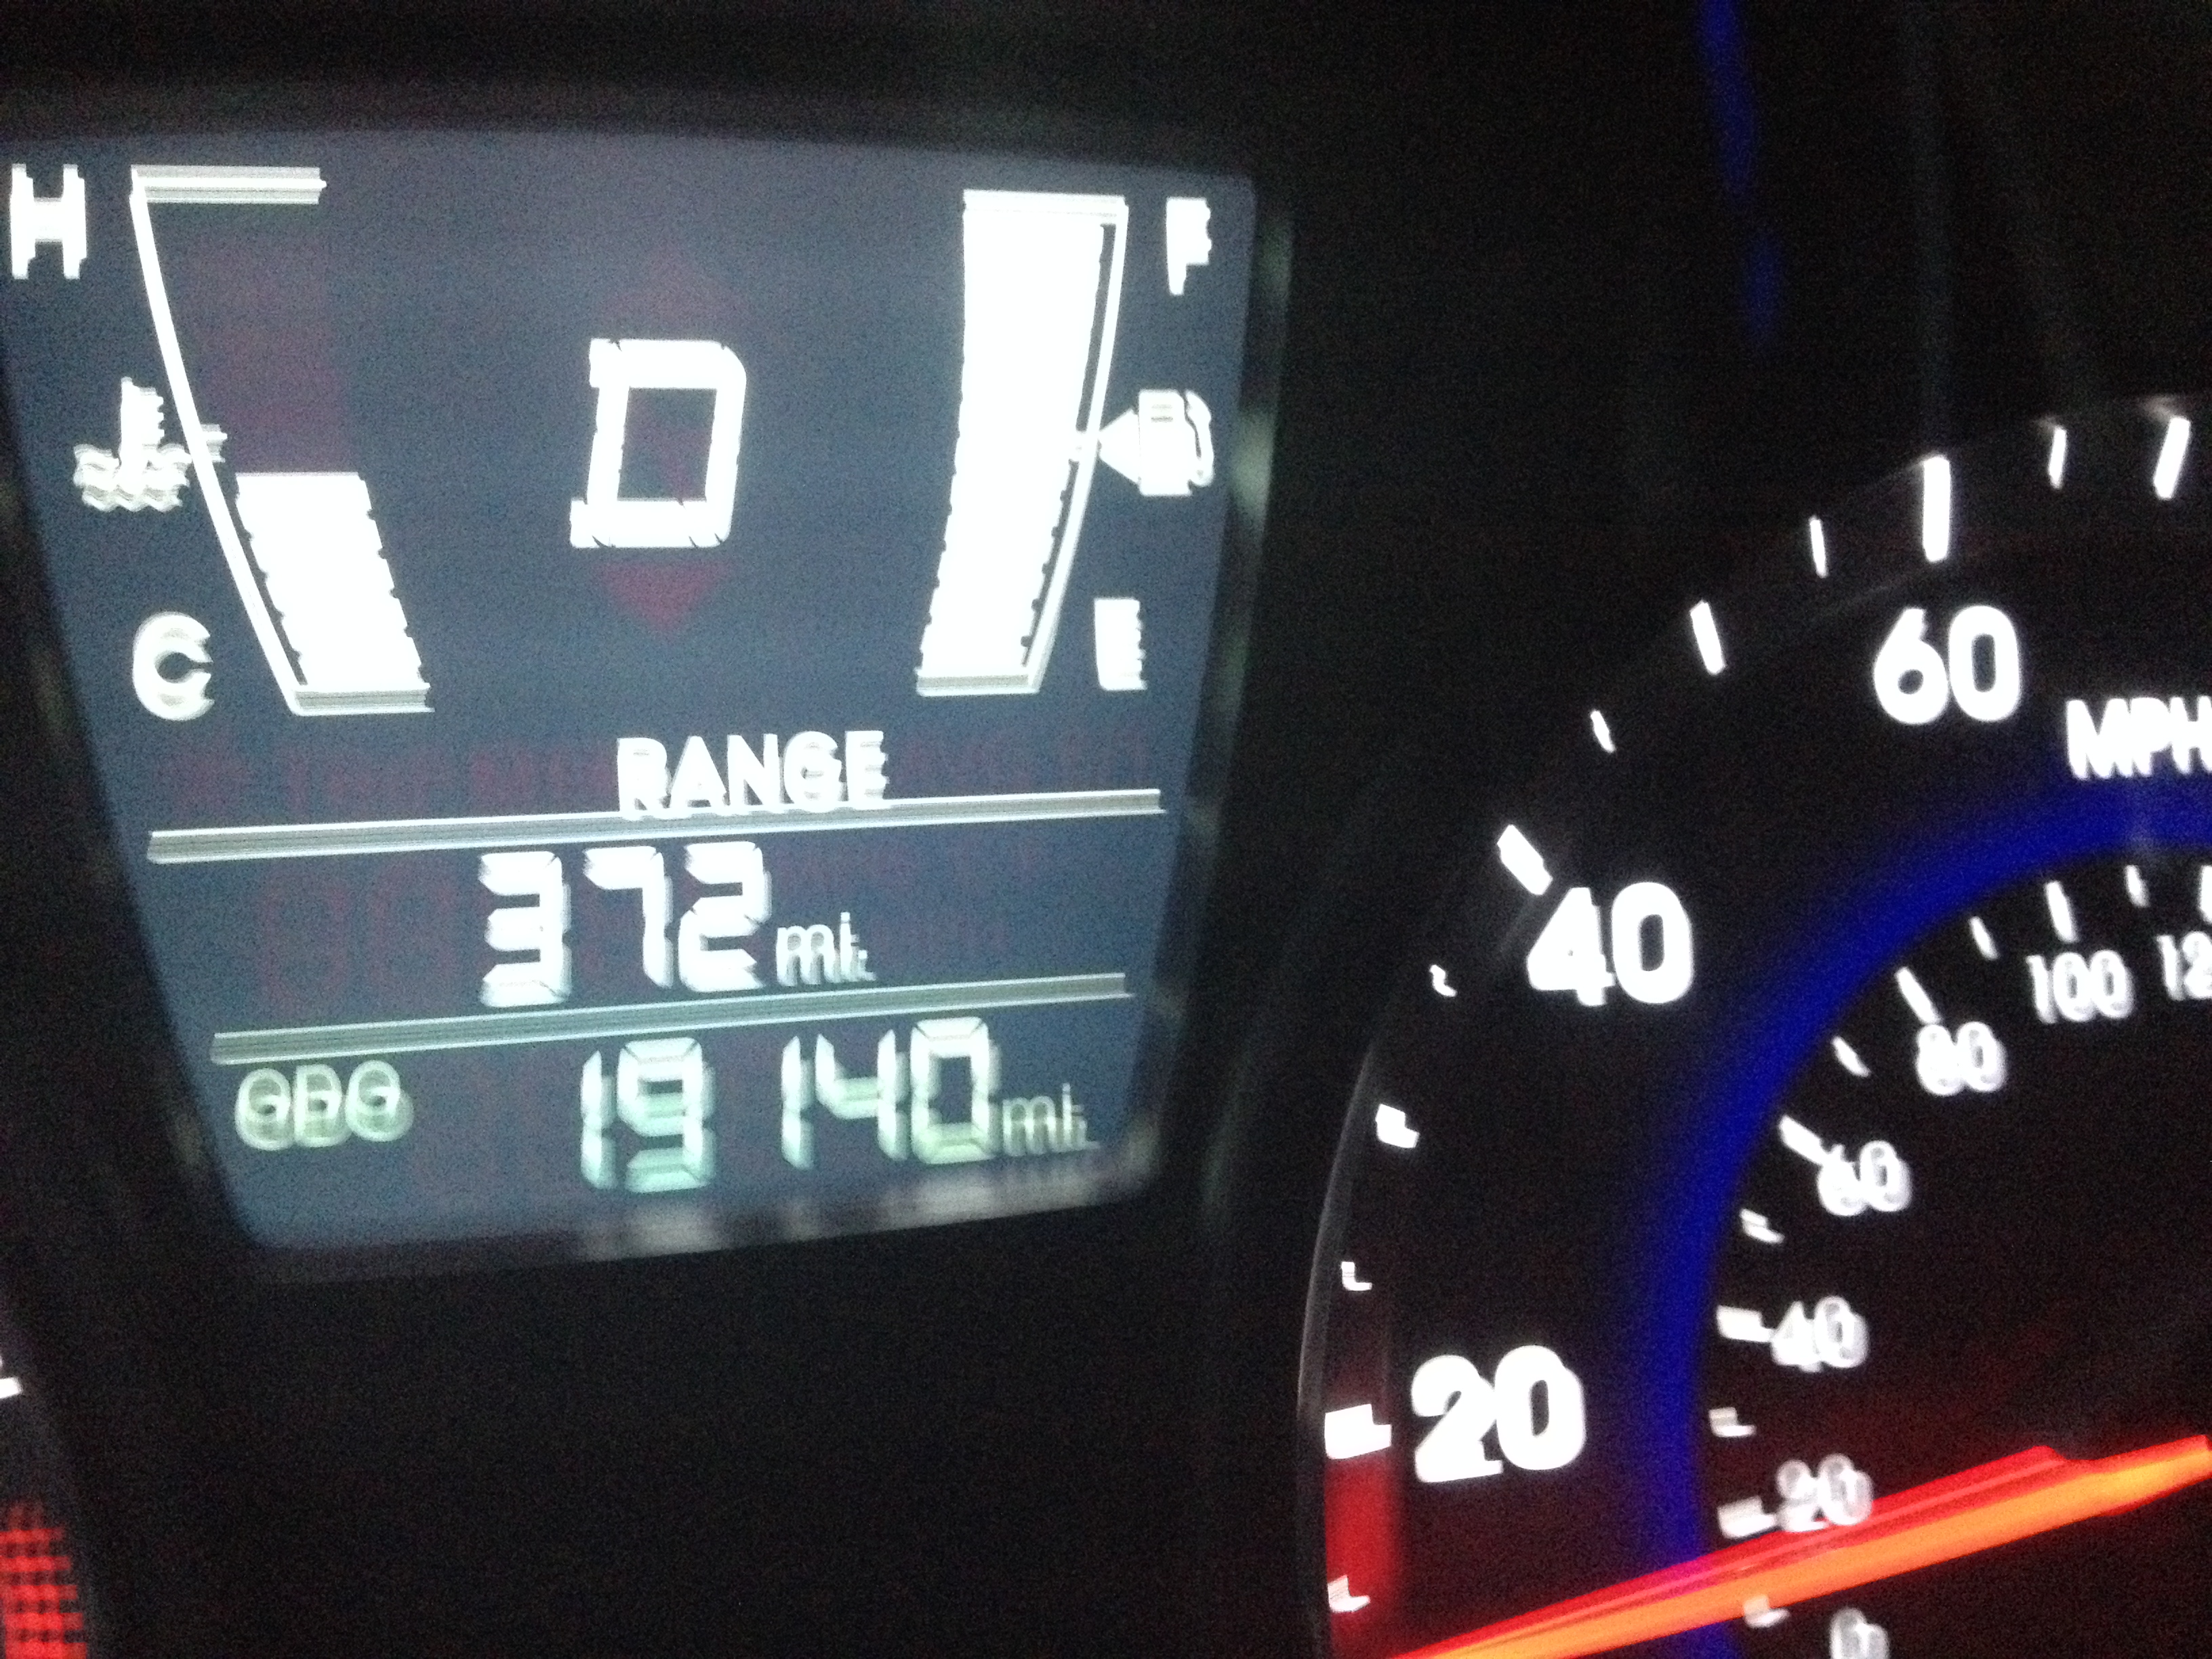
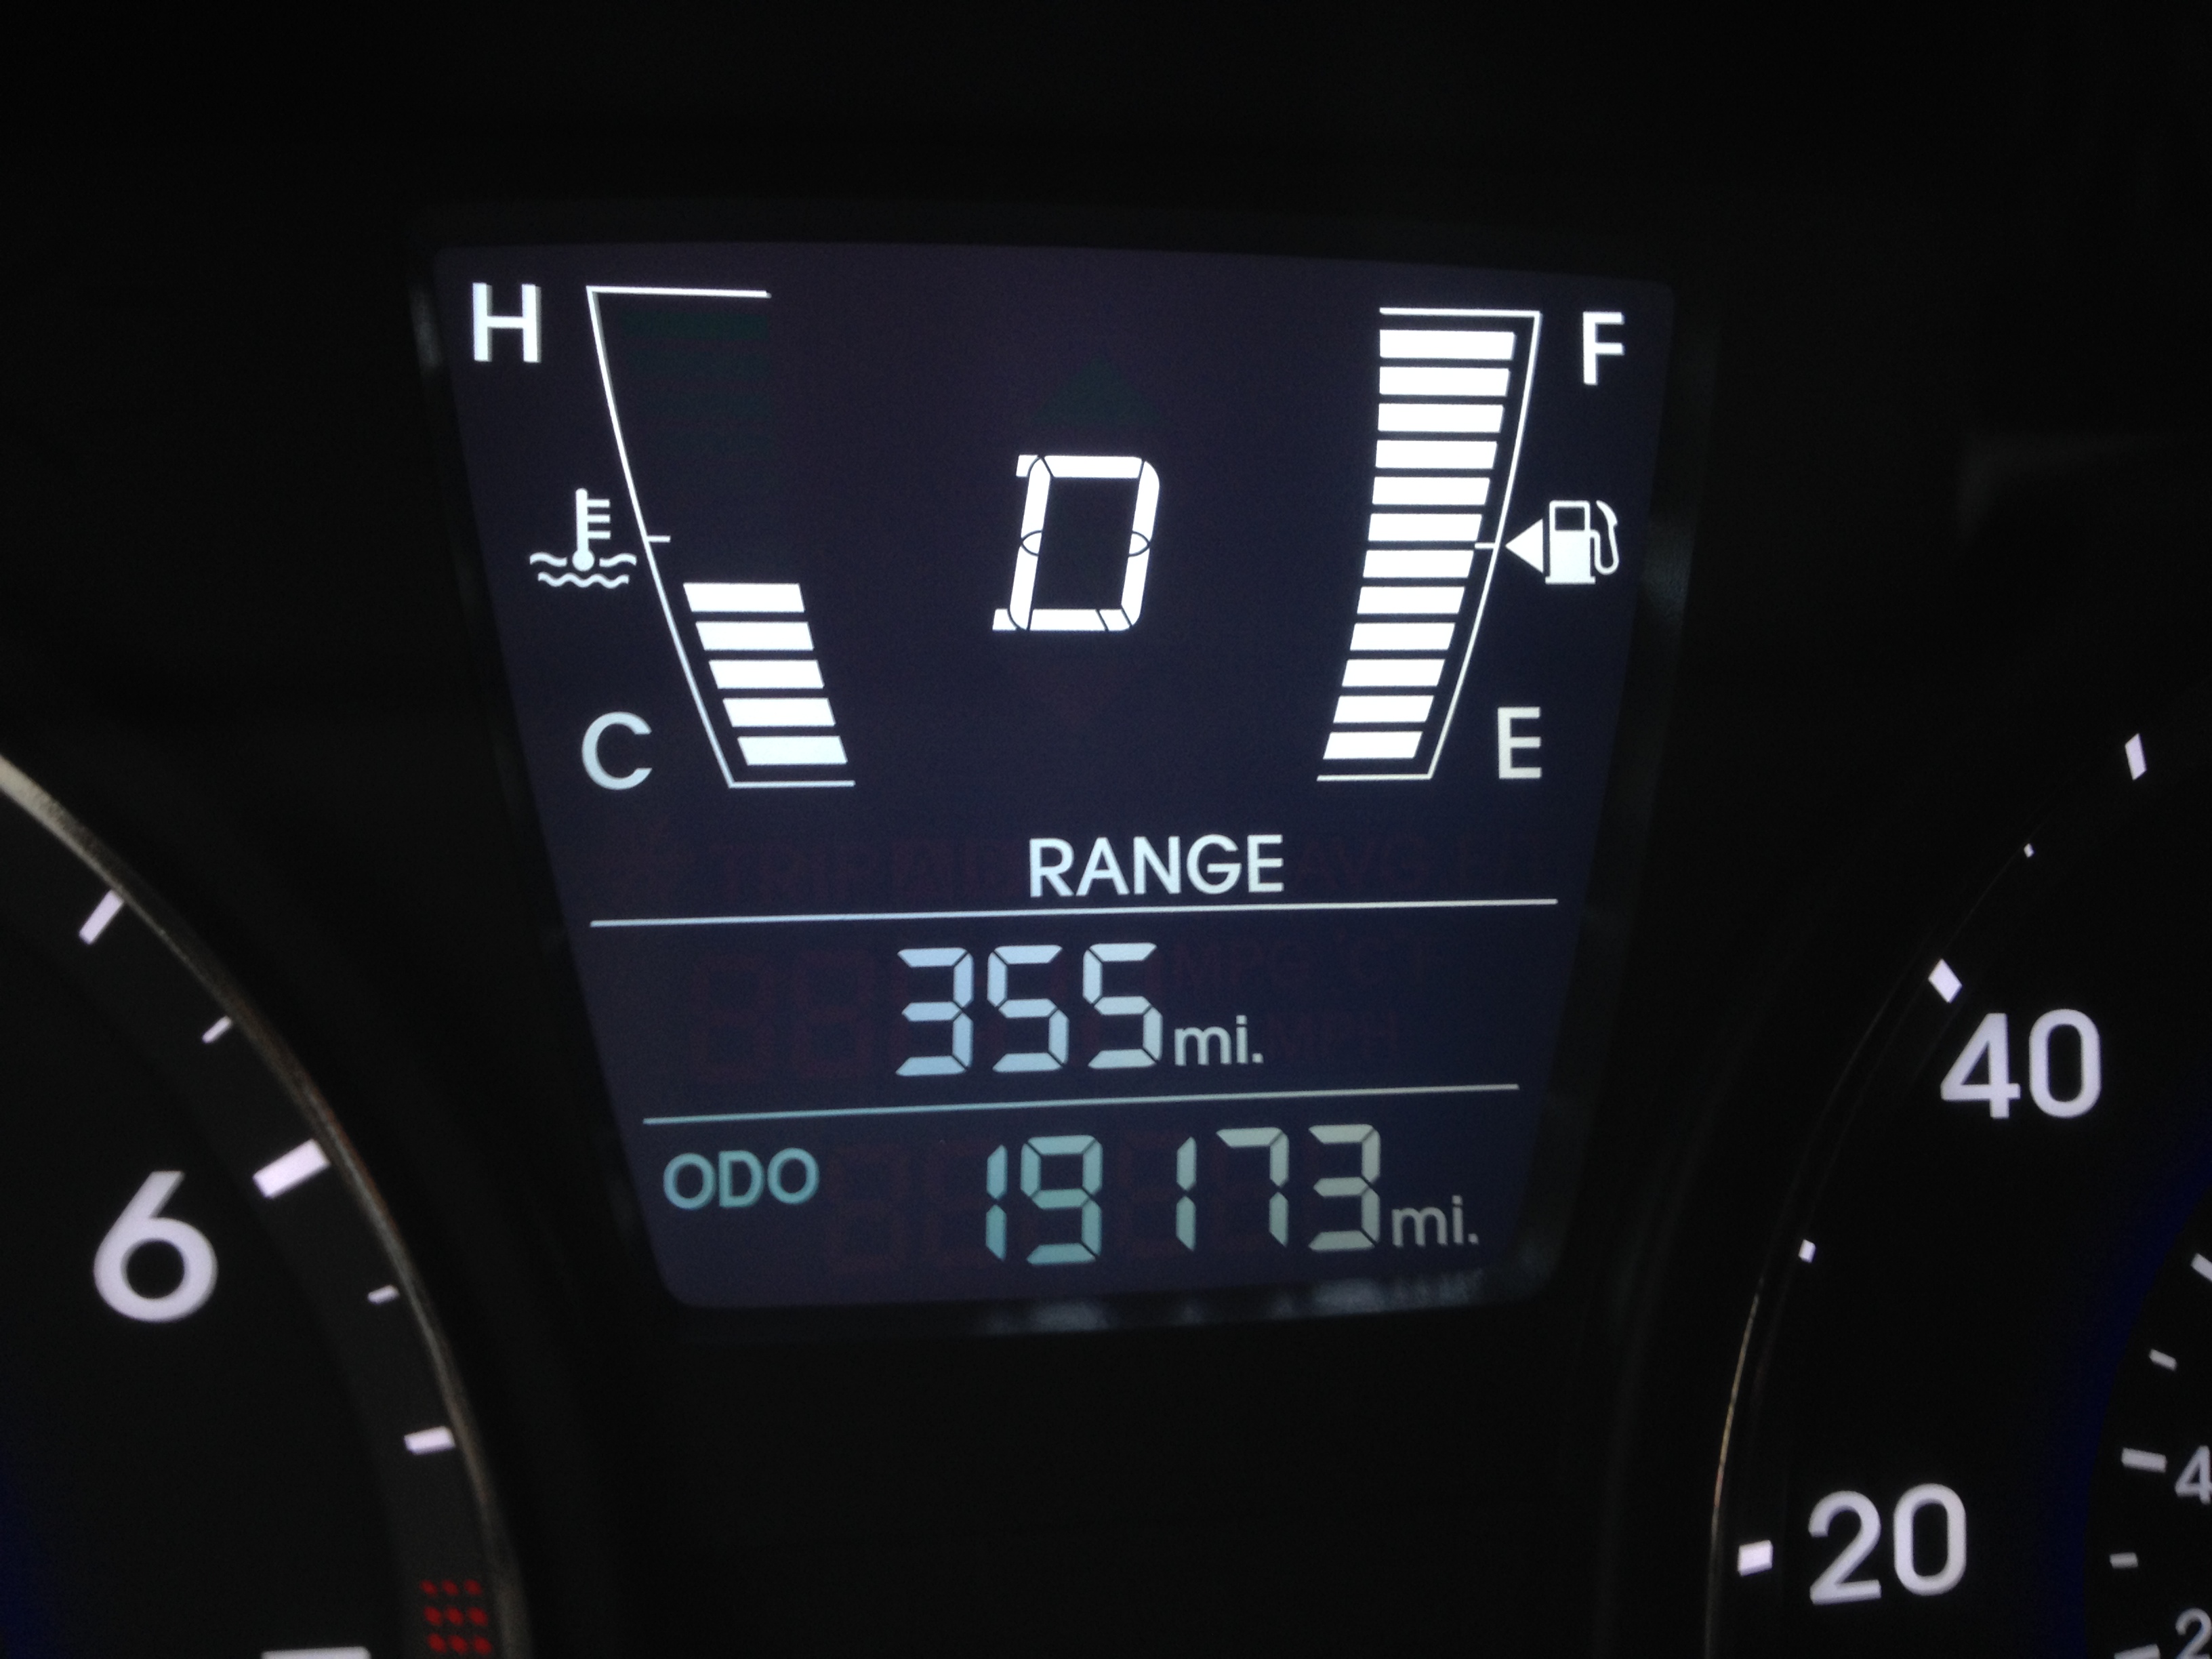
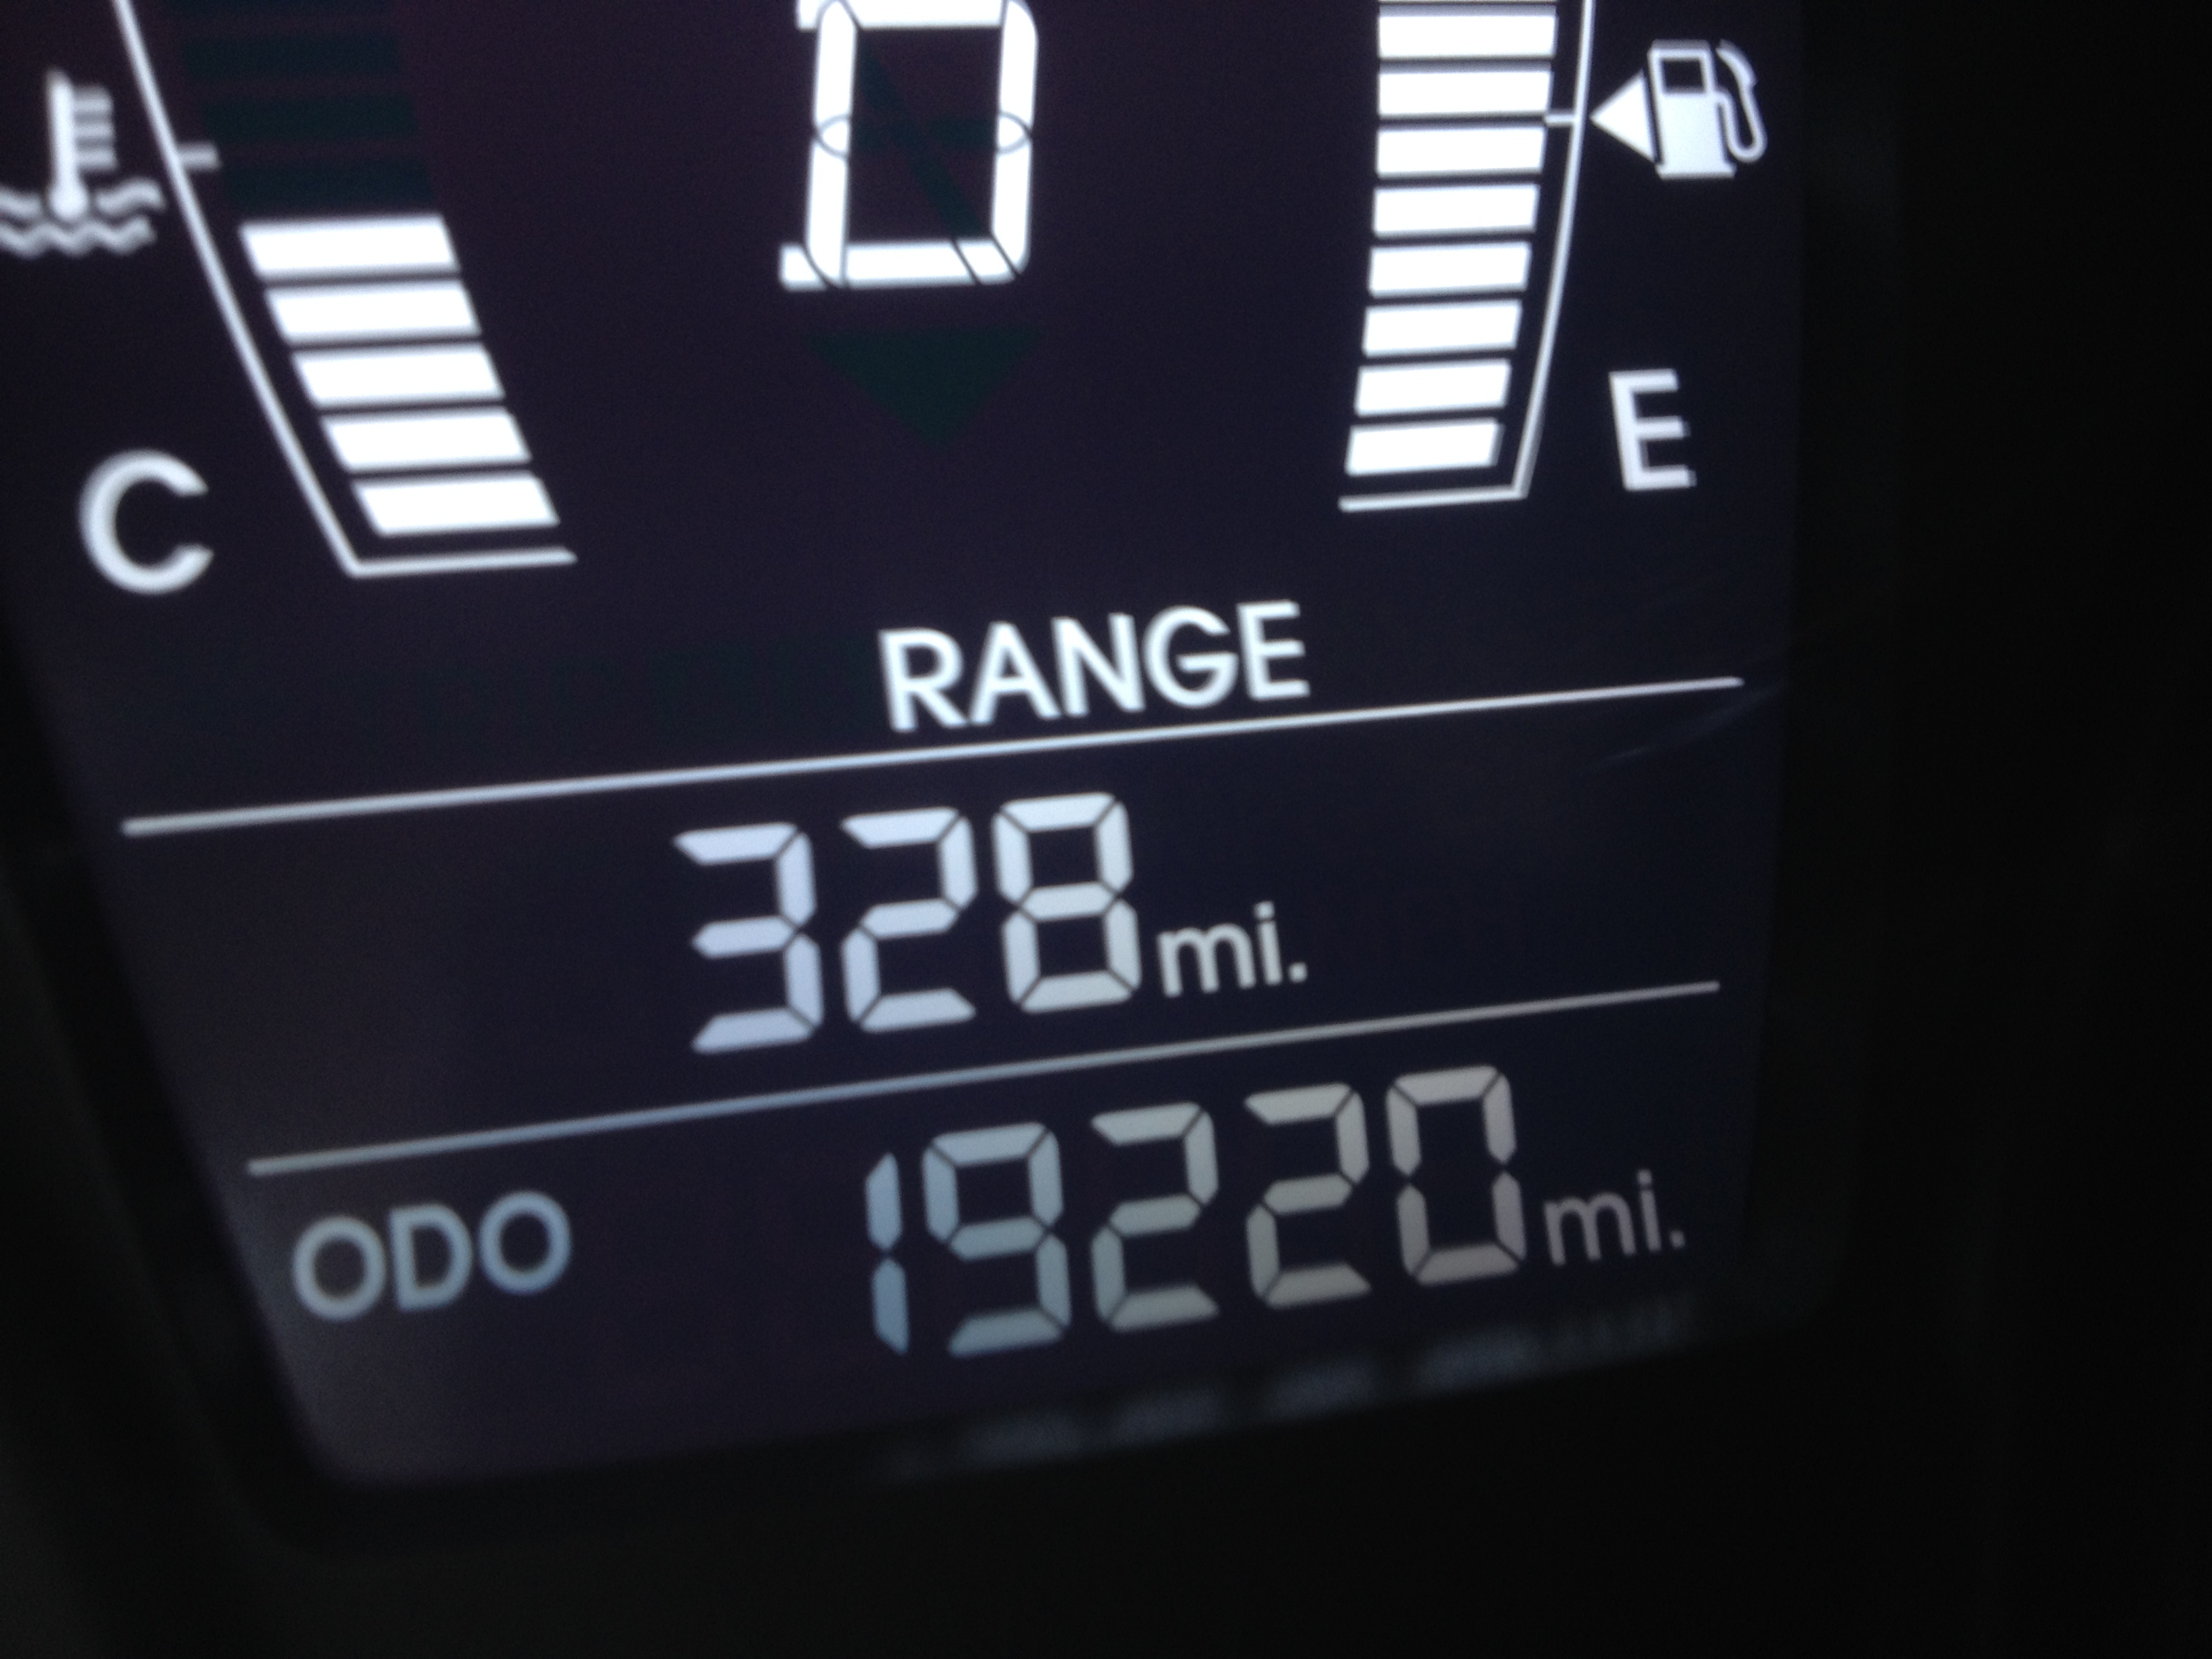
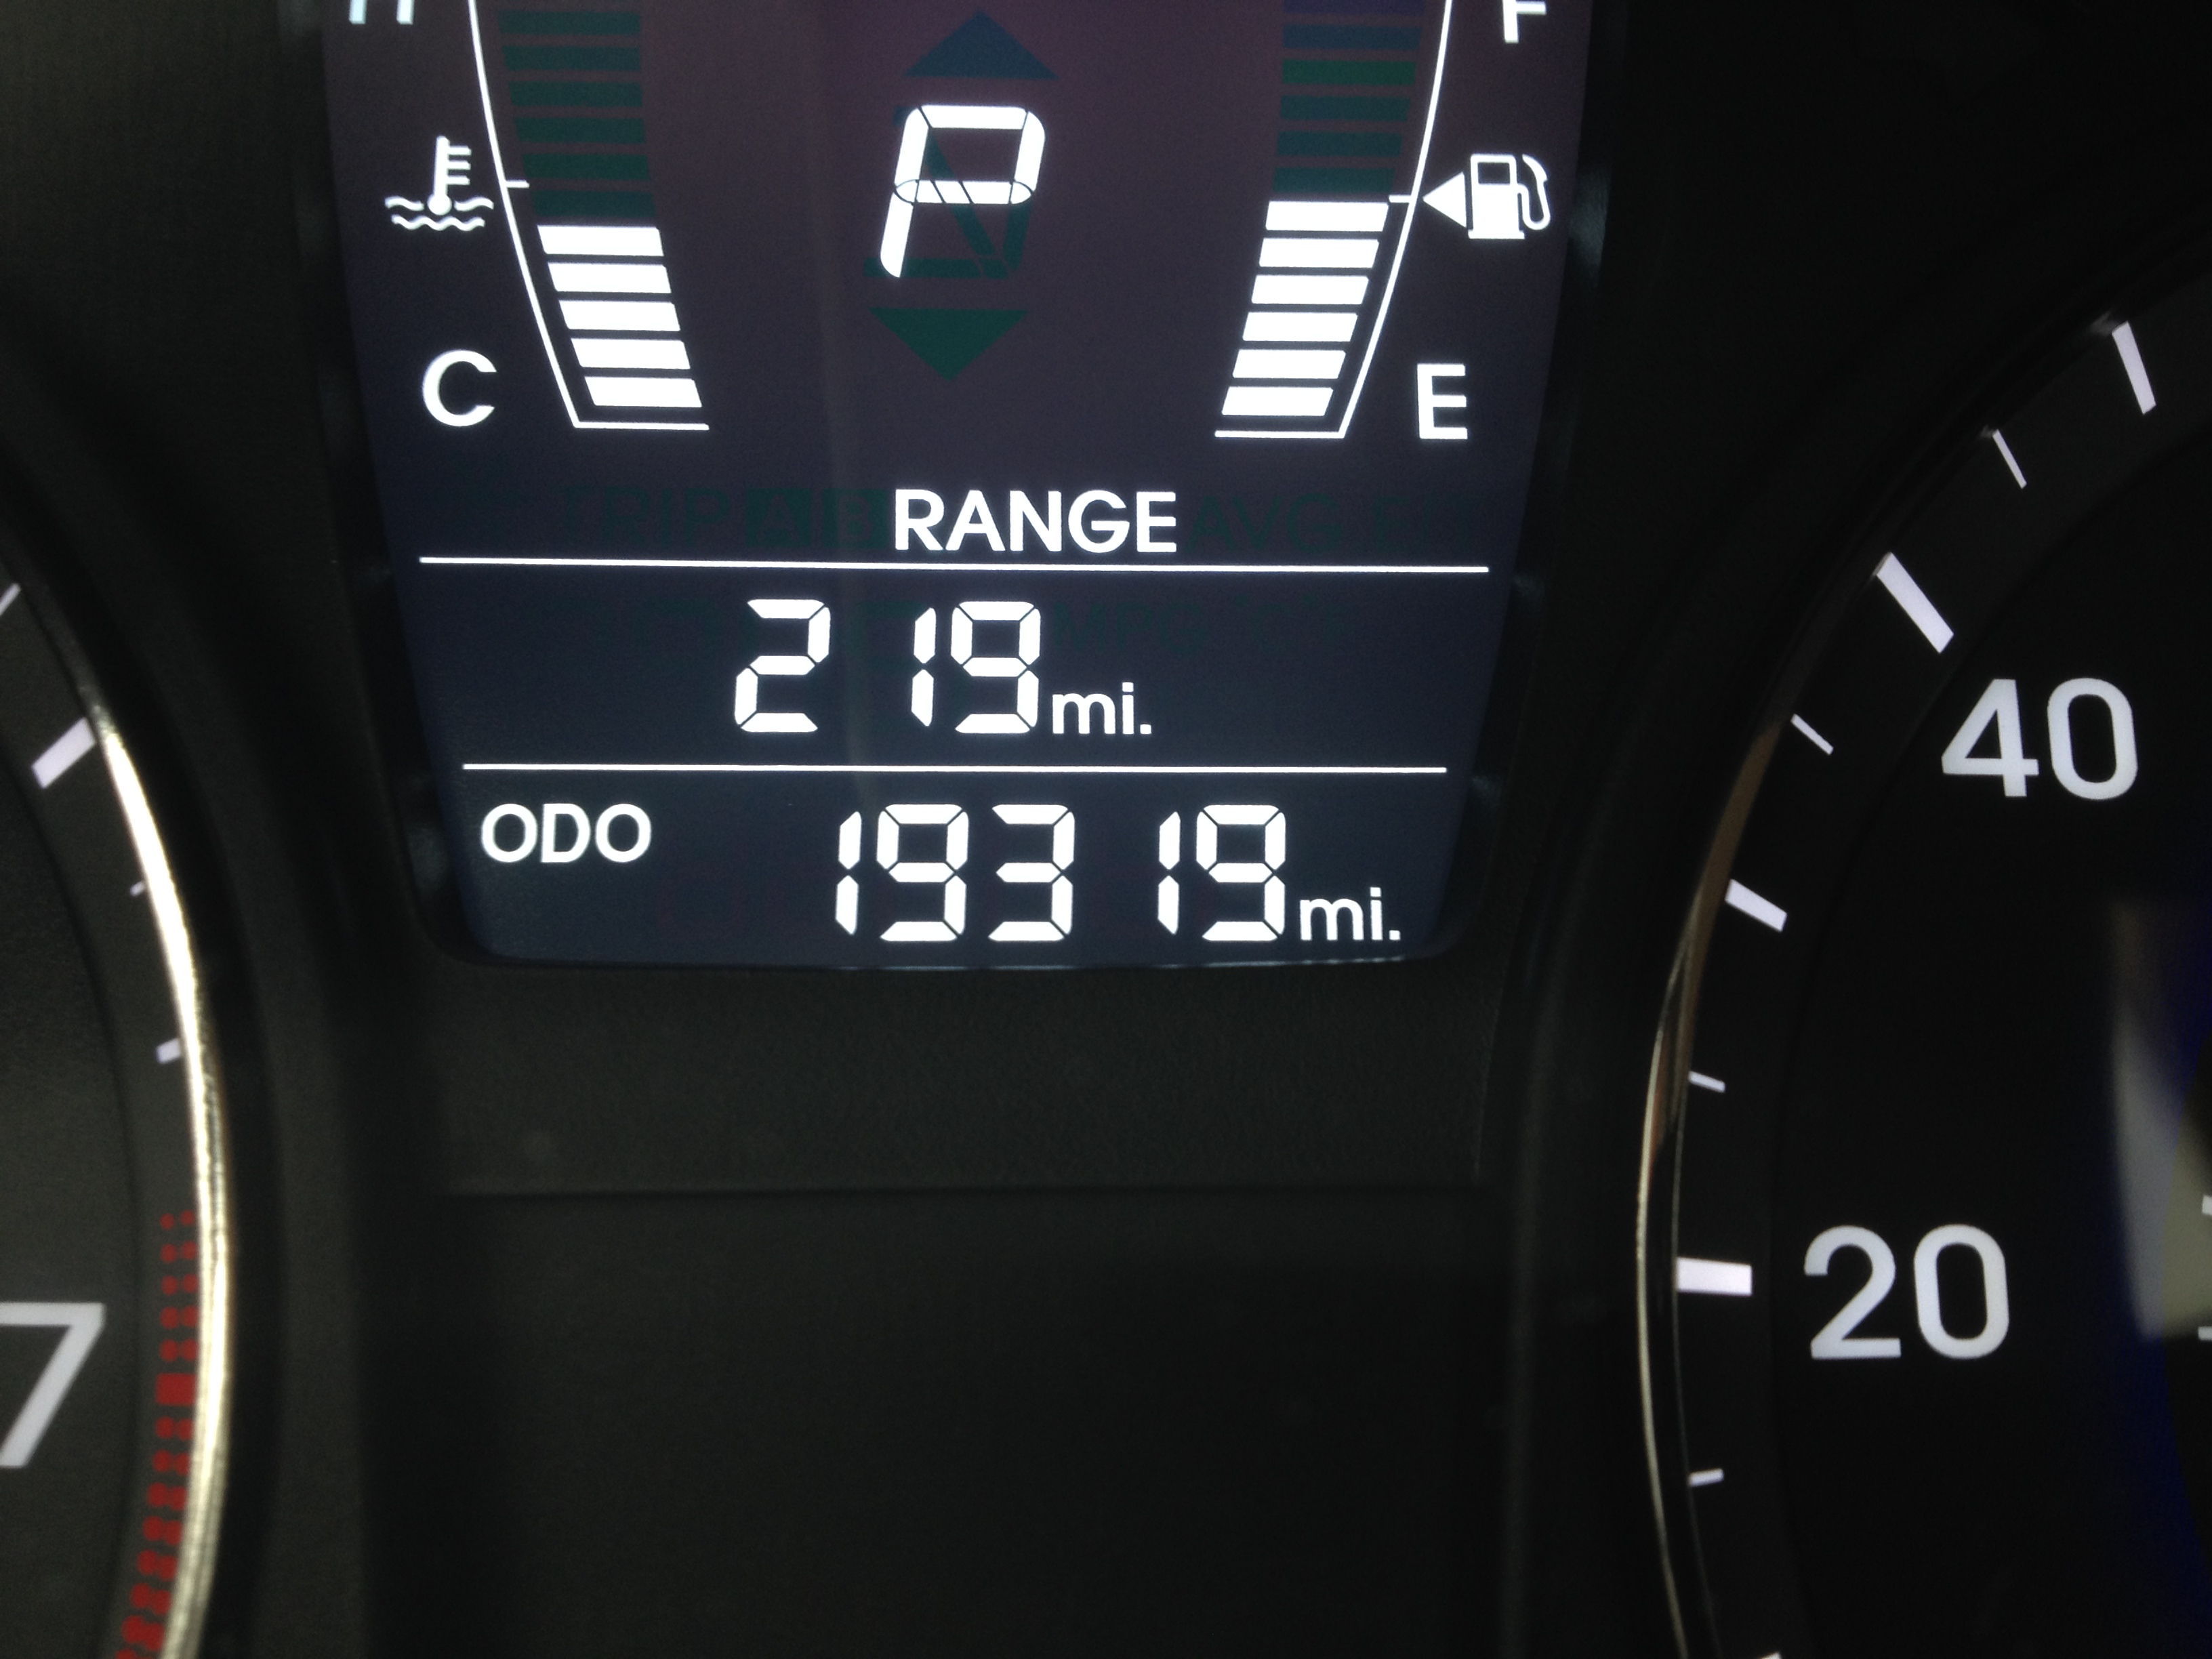
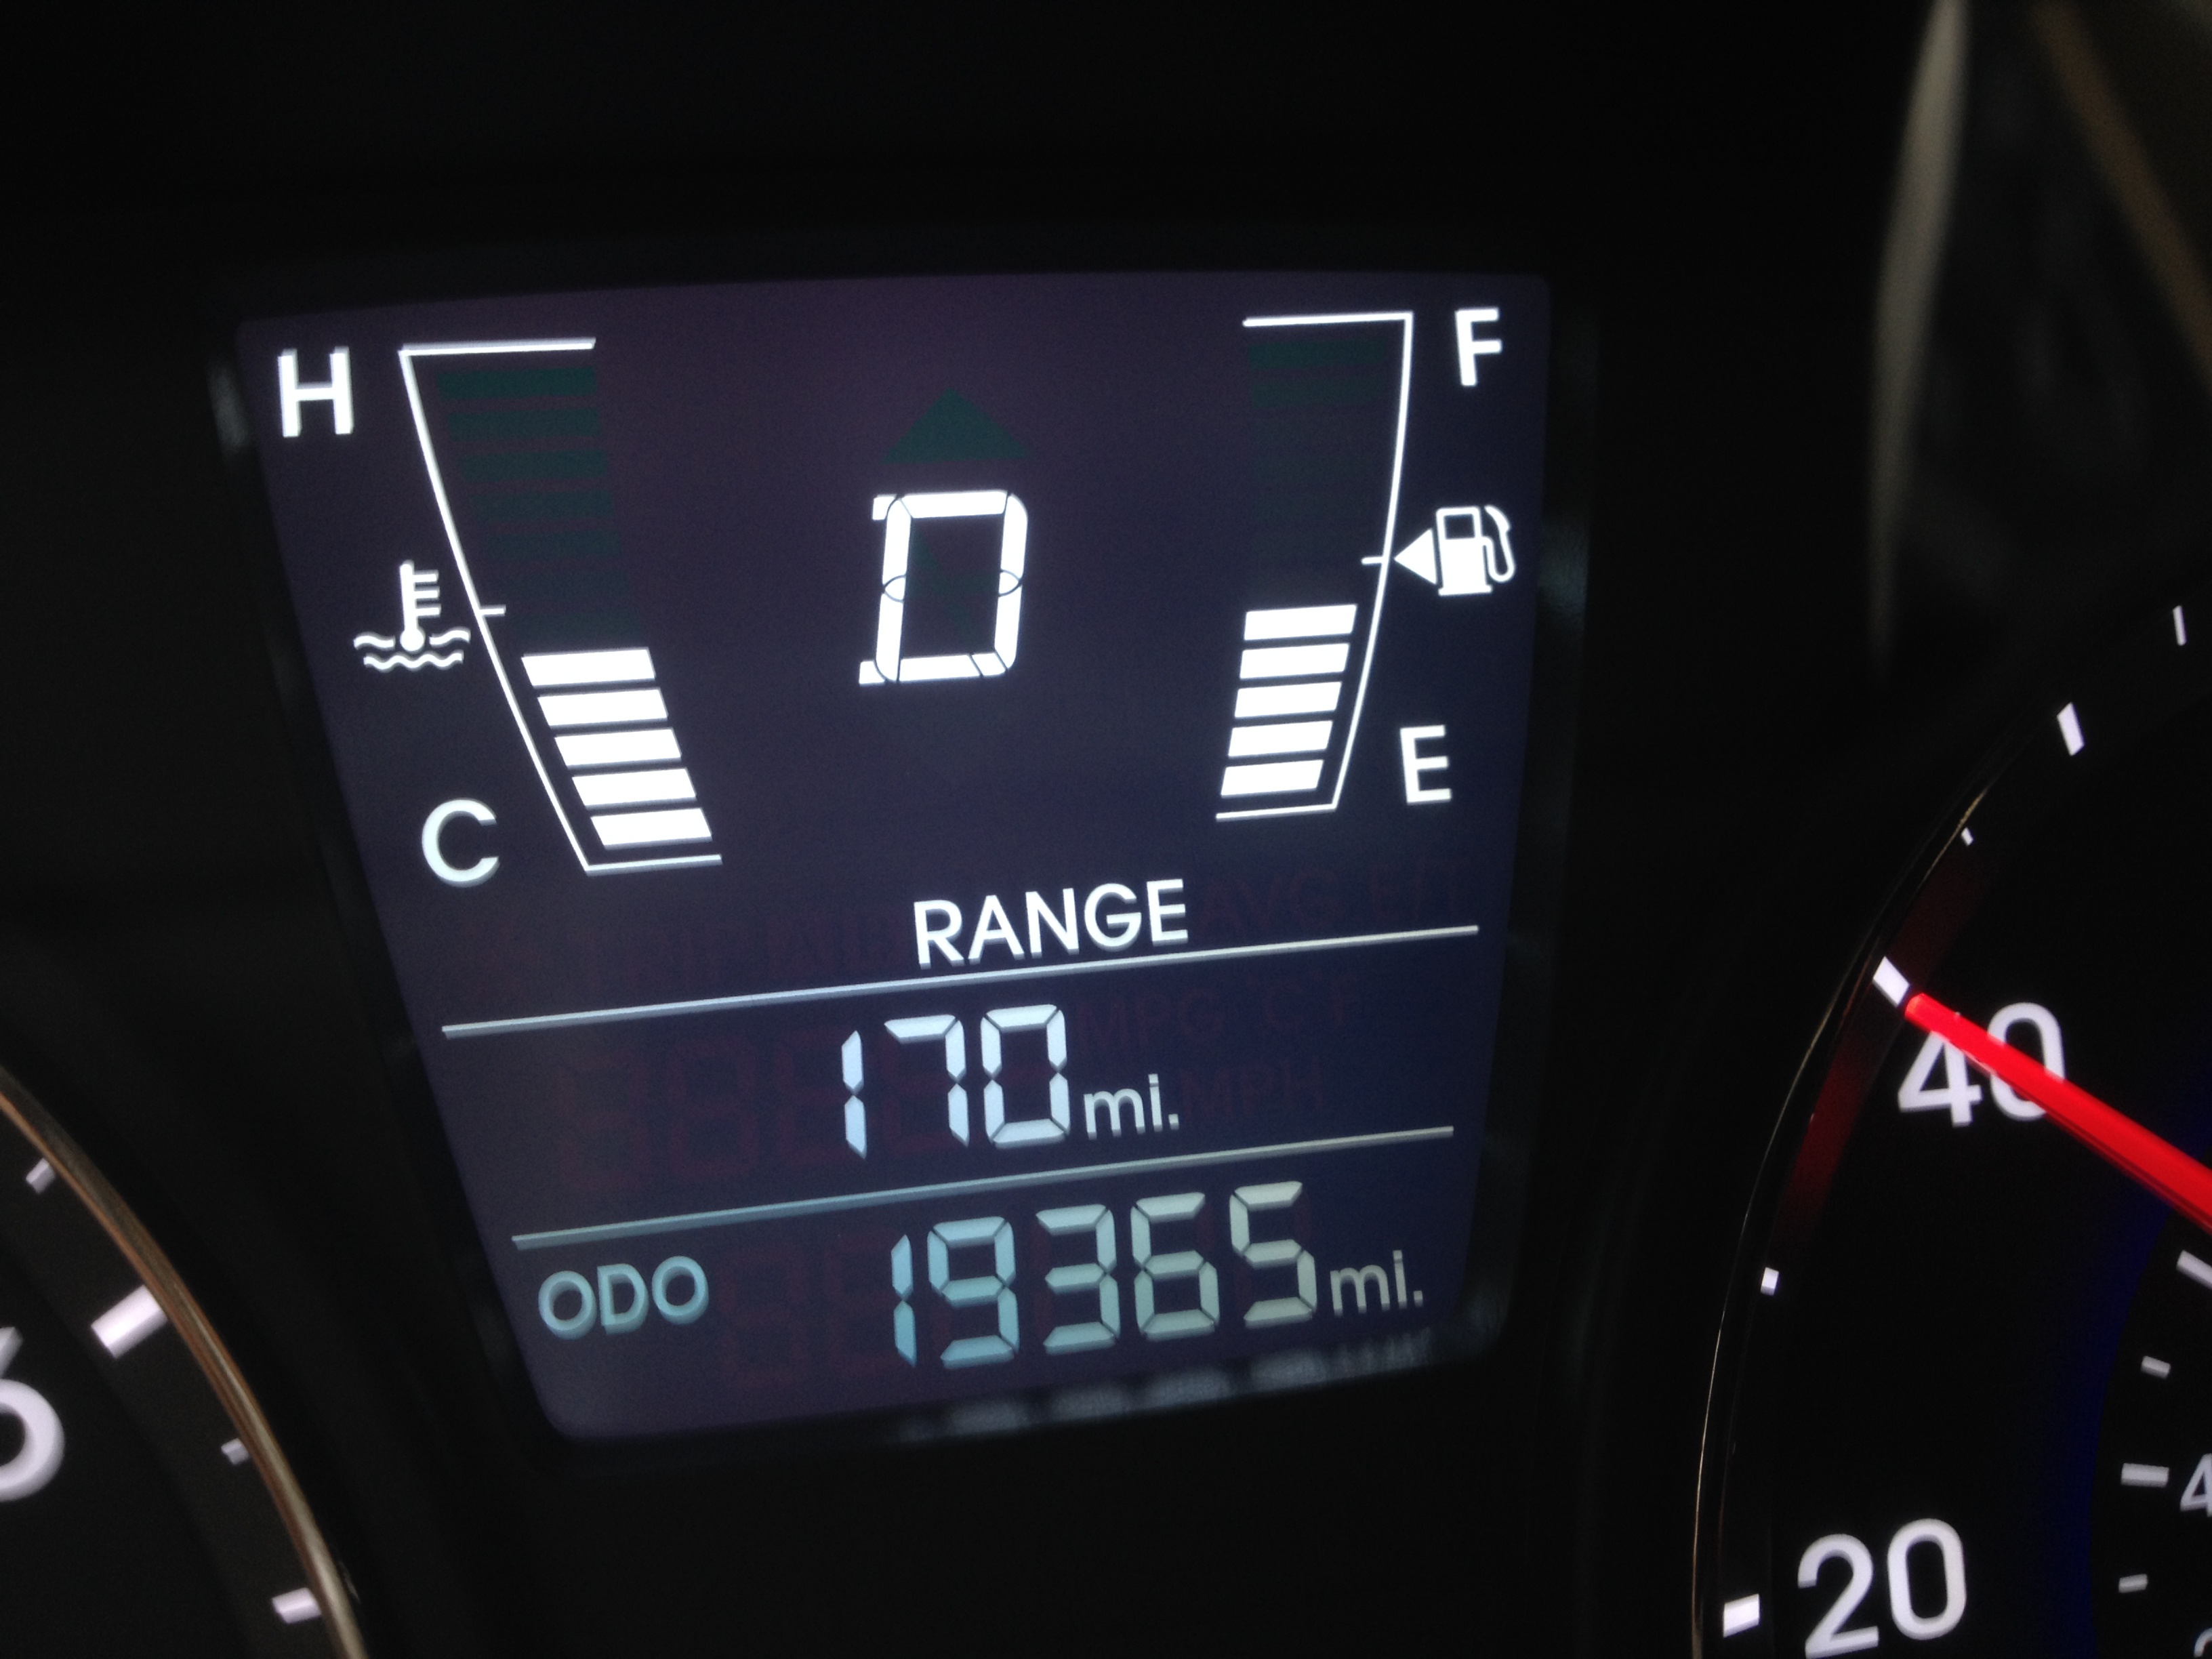
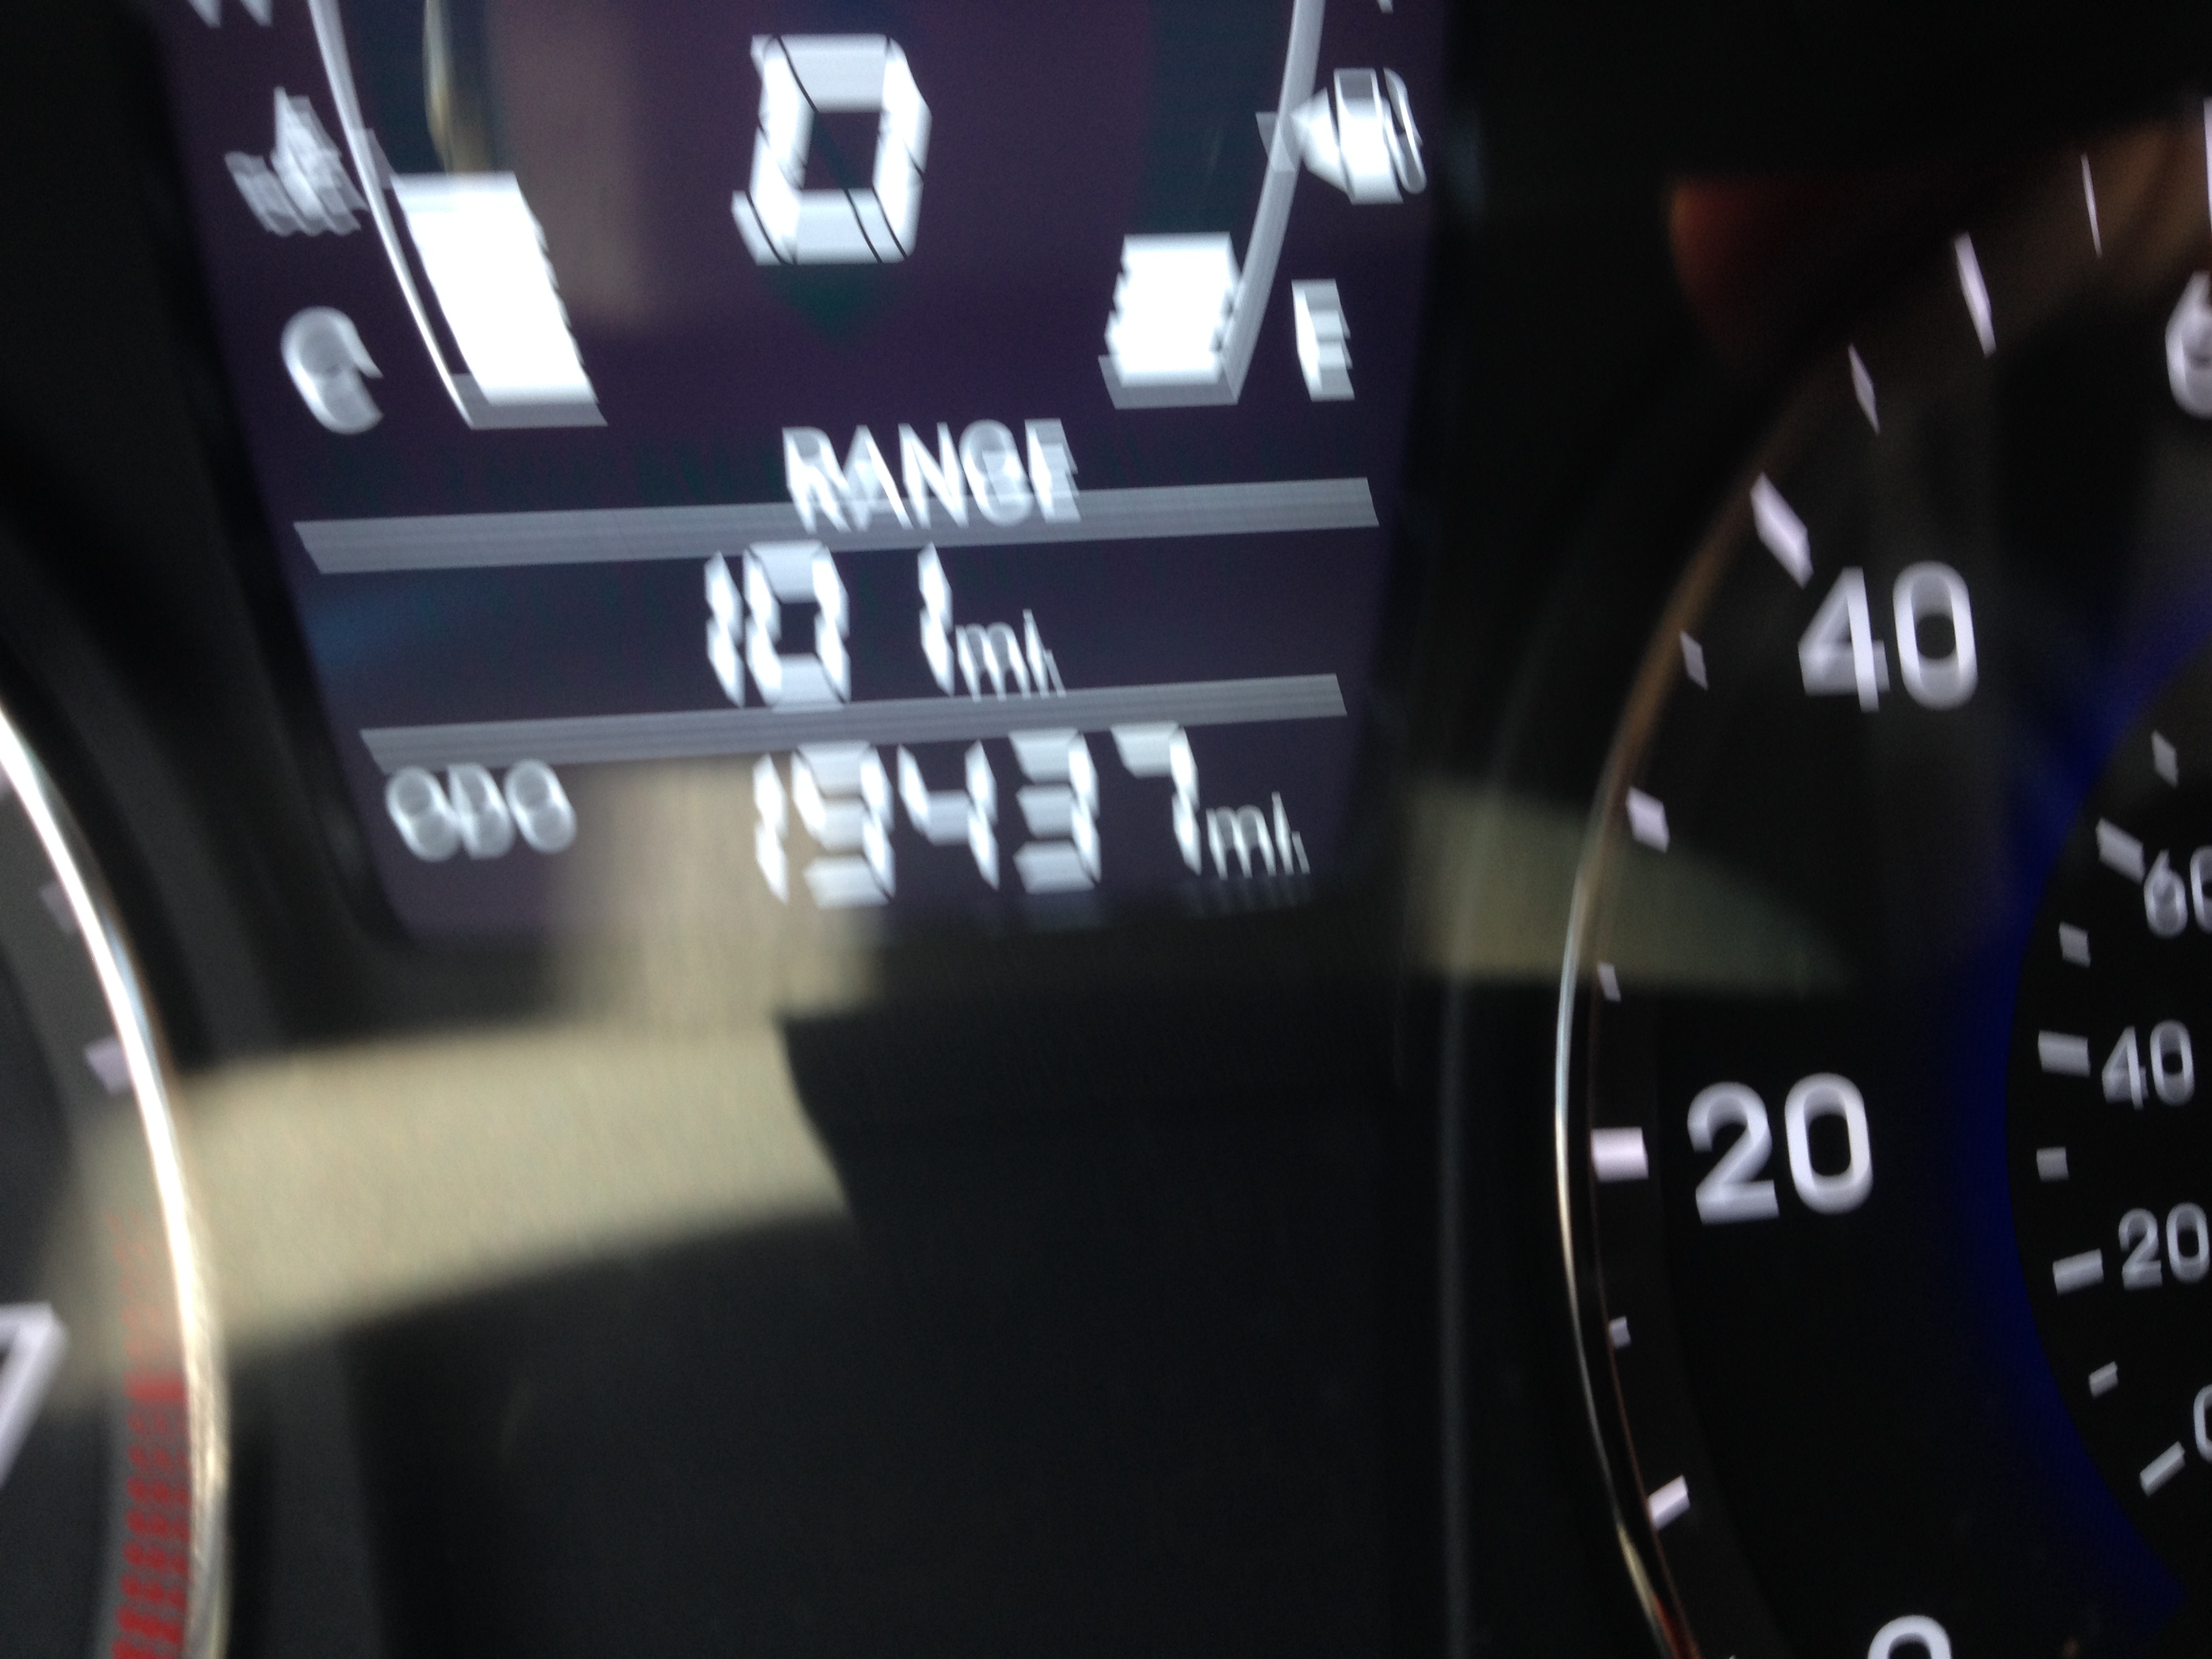
I filled up my car with gas recently and this is what I saw when I started the car:

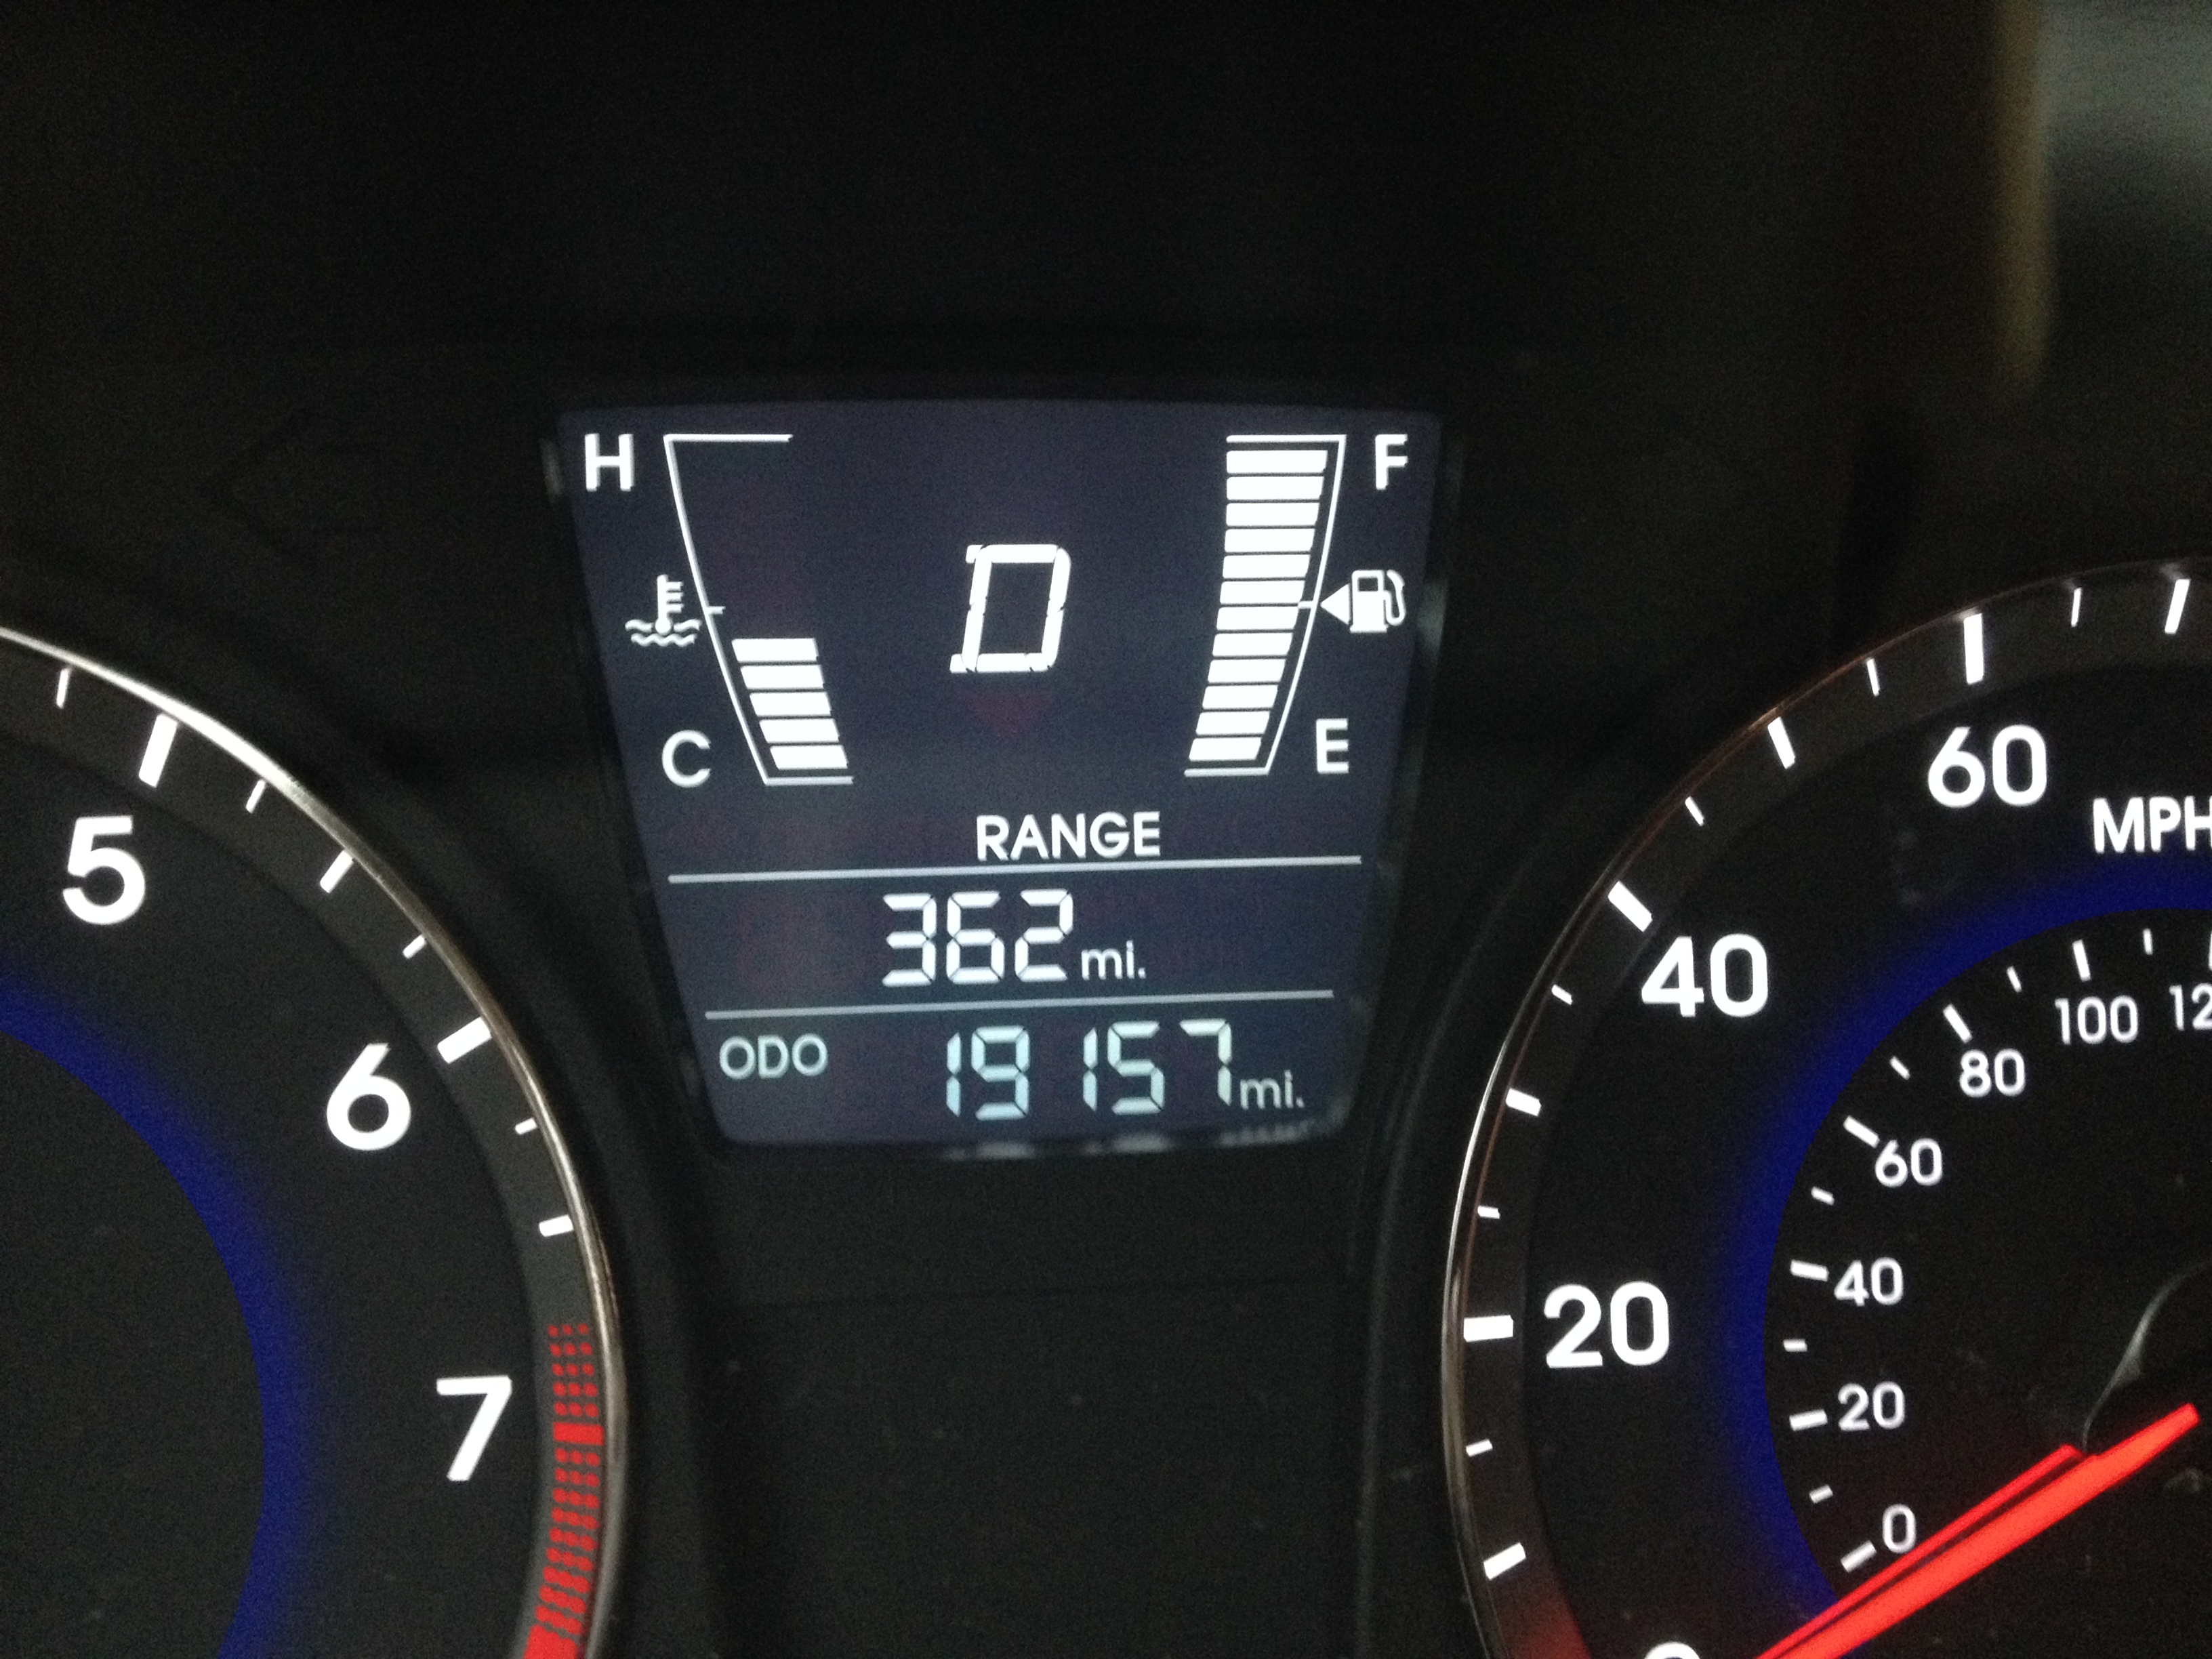
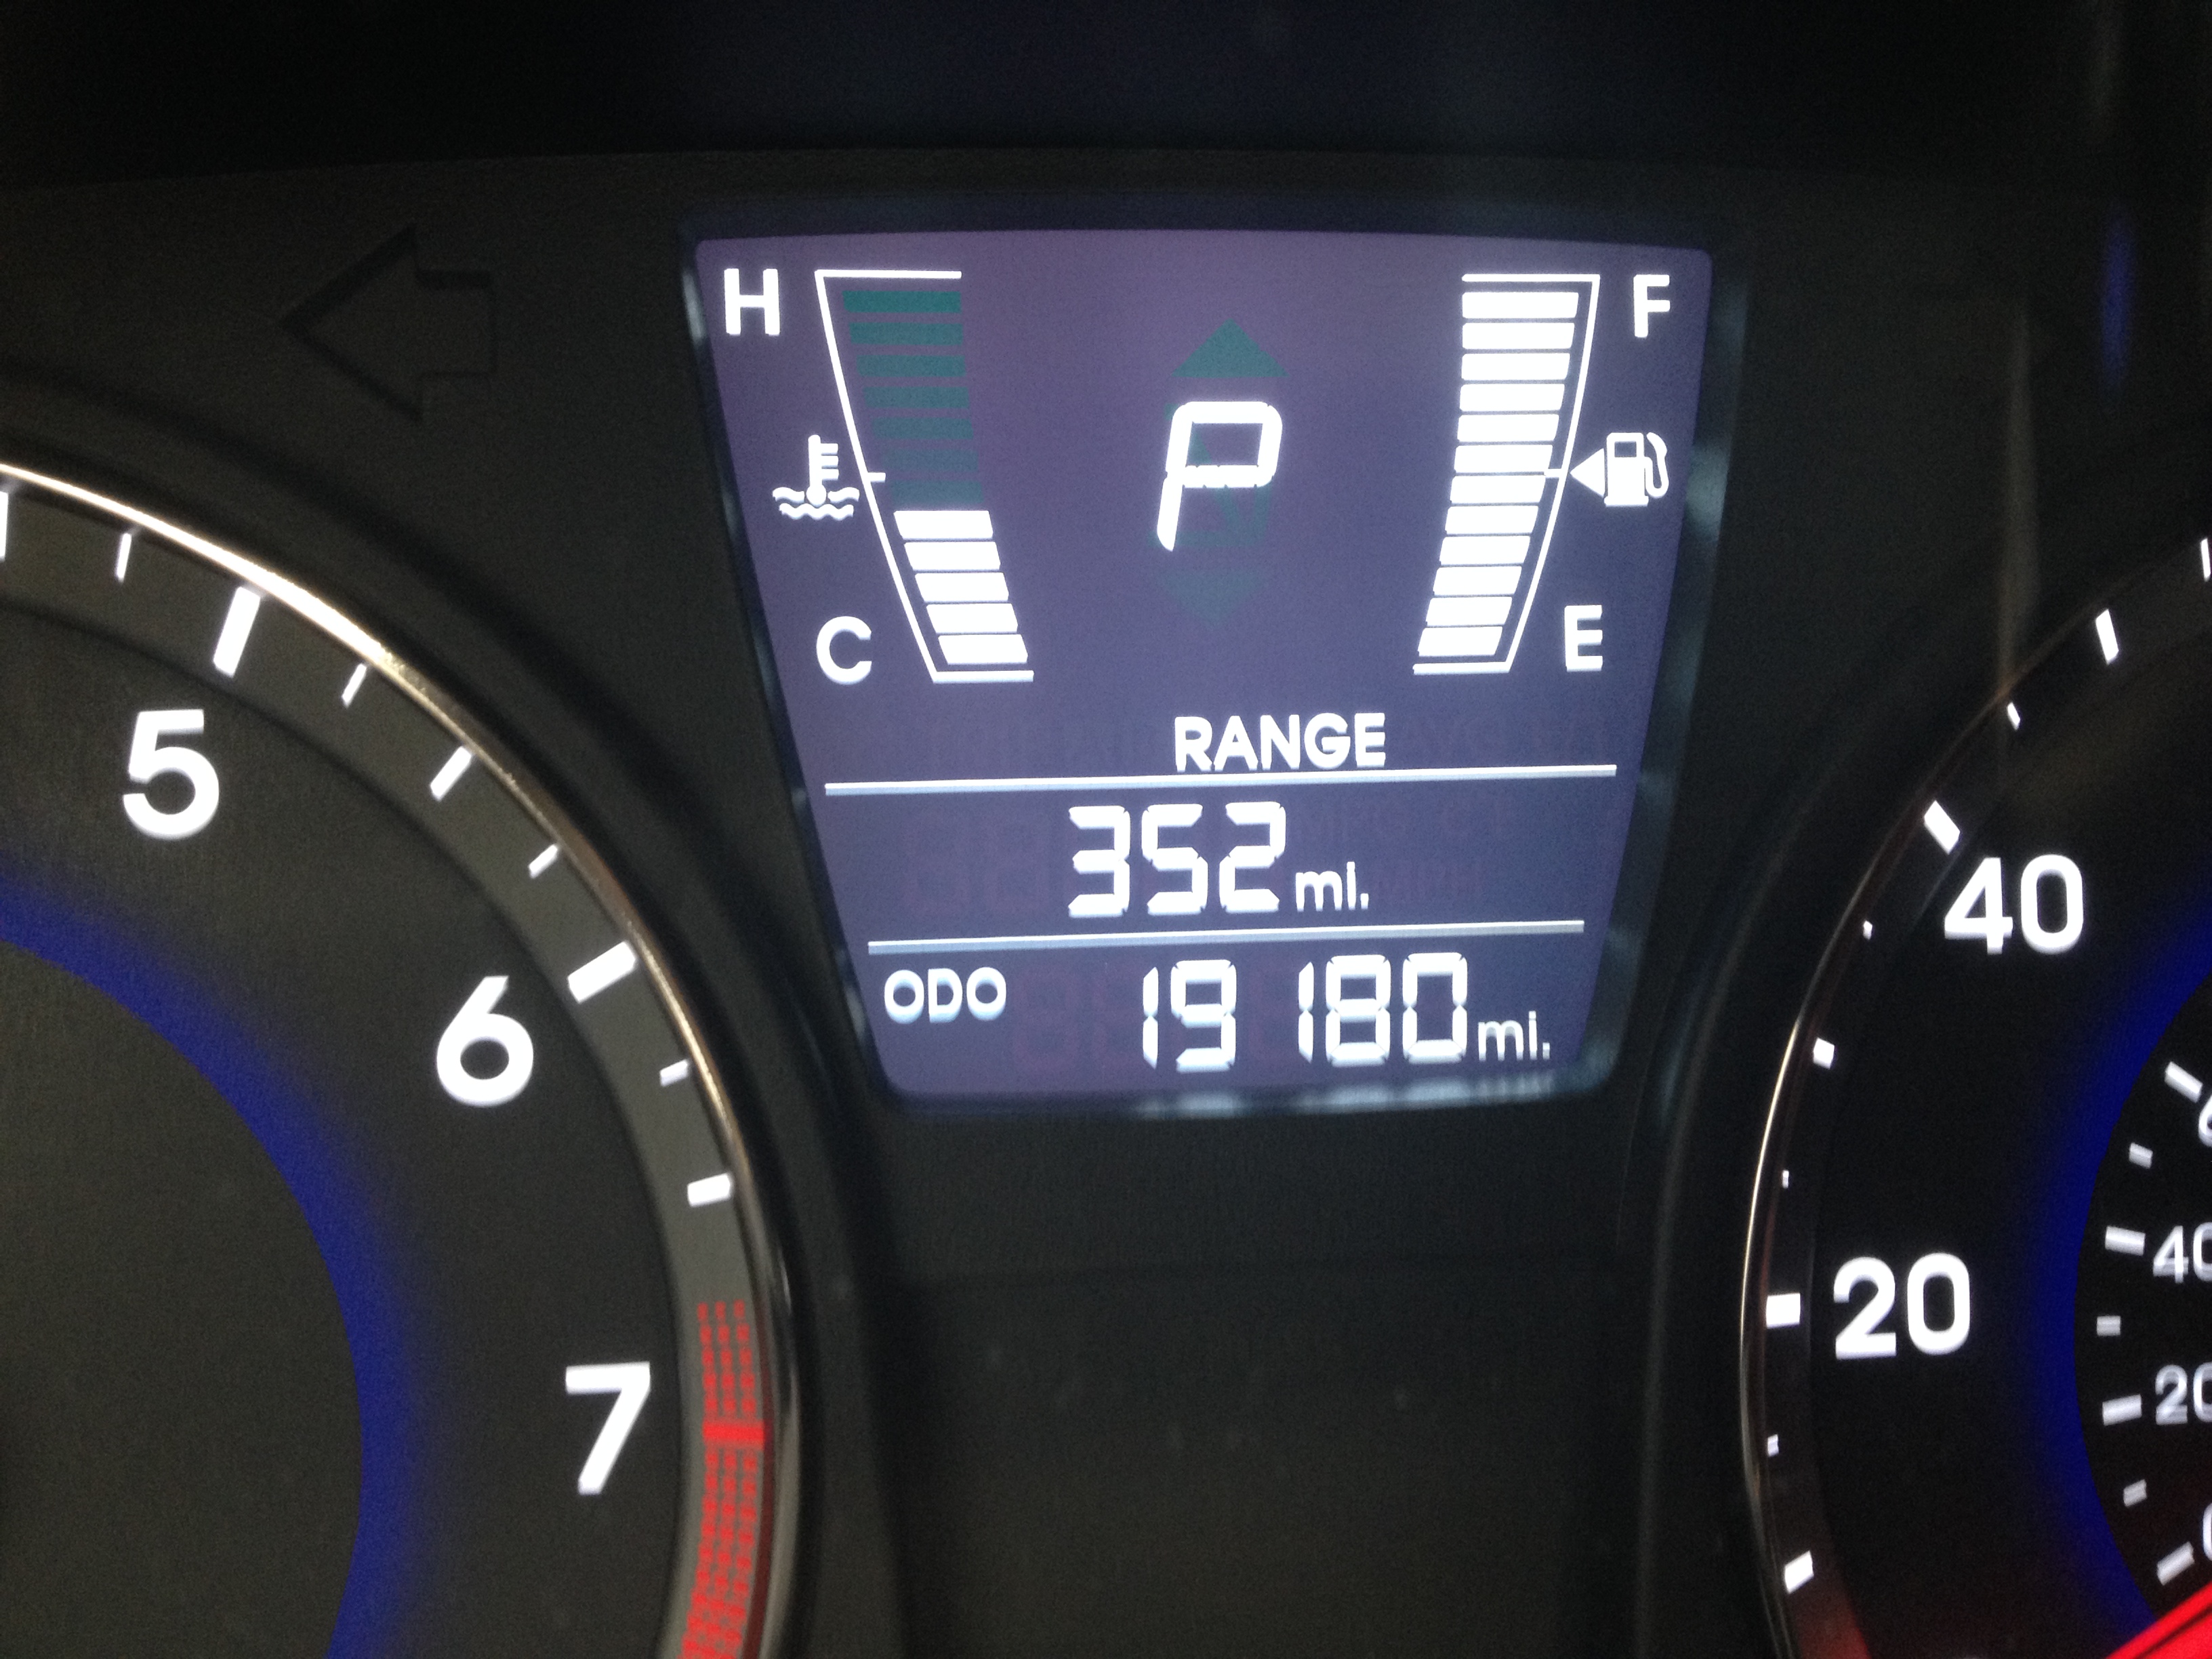
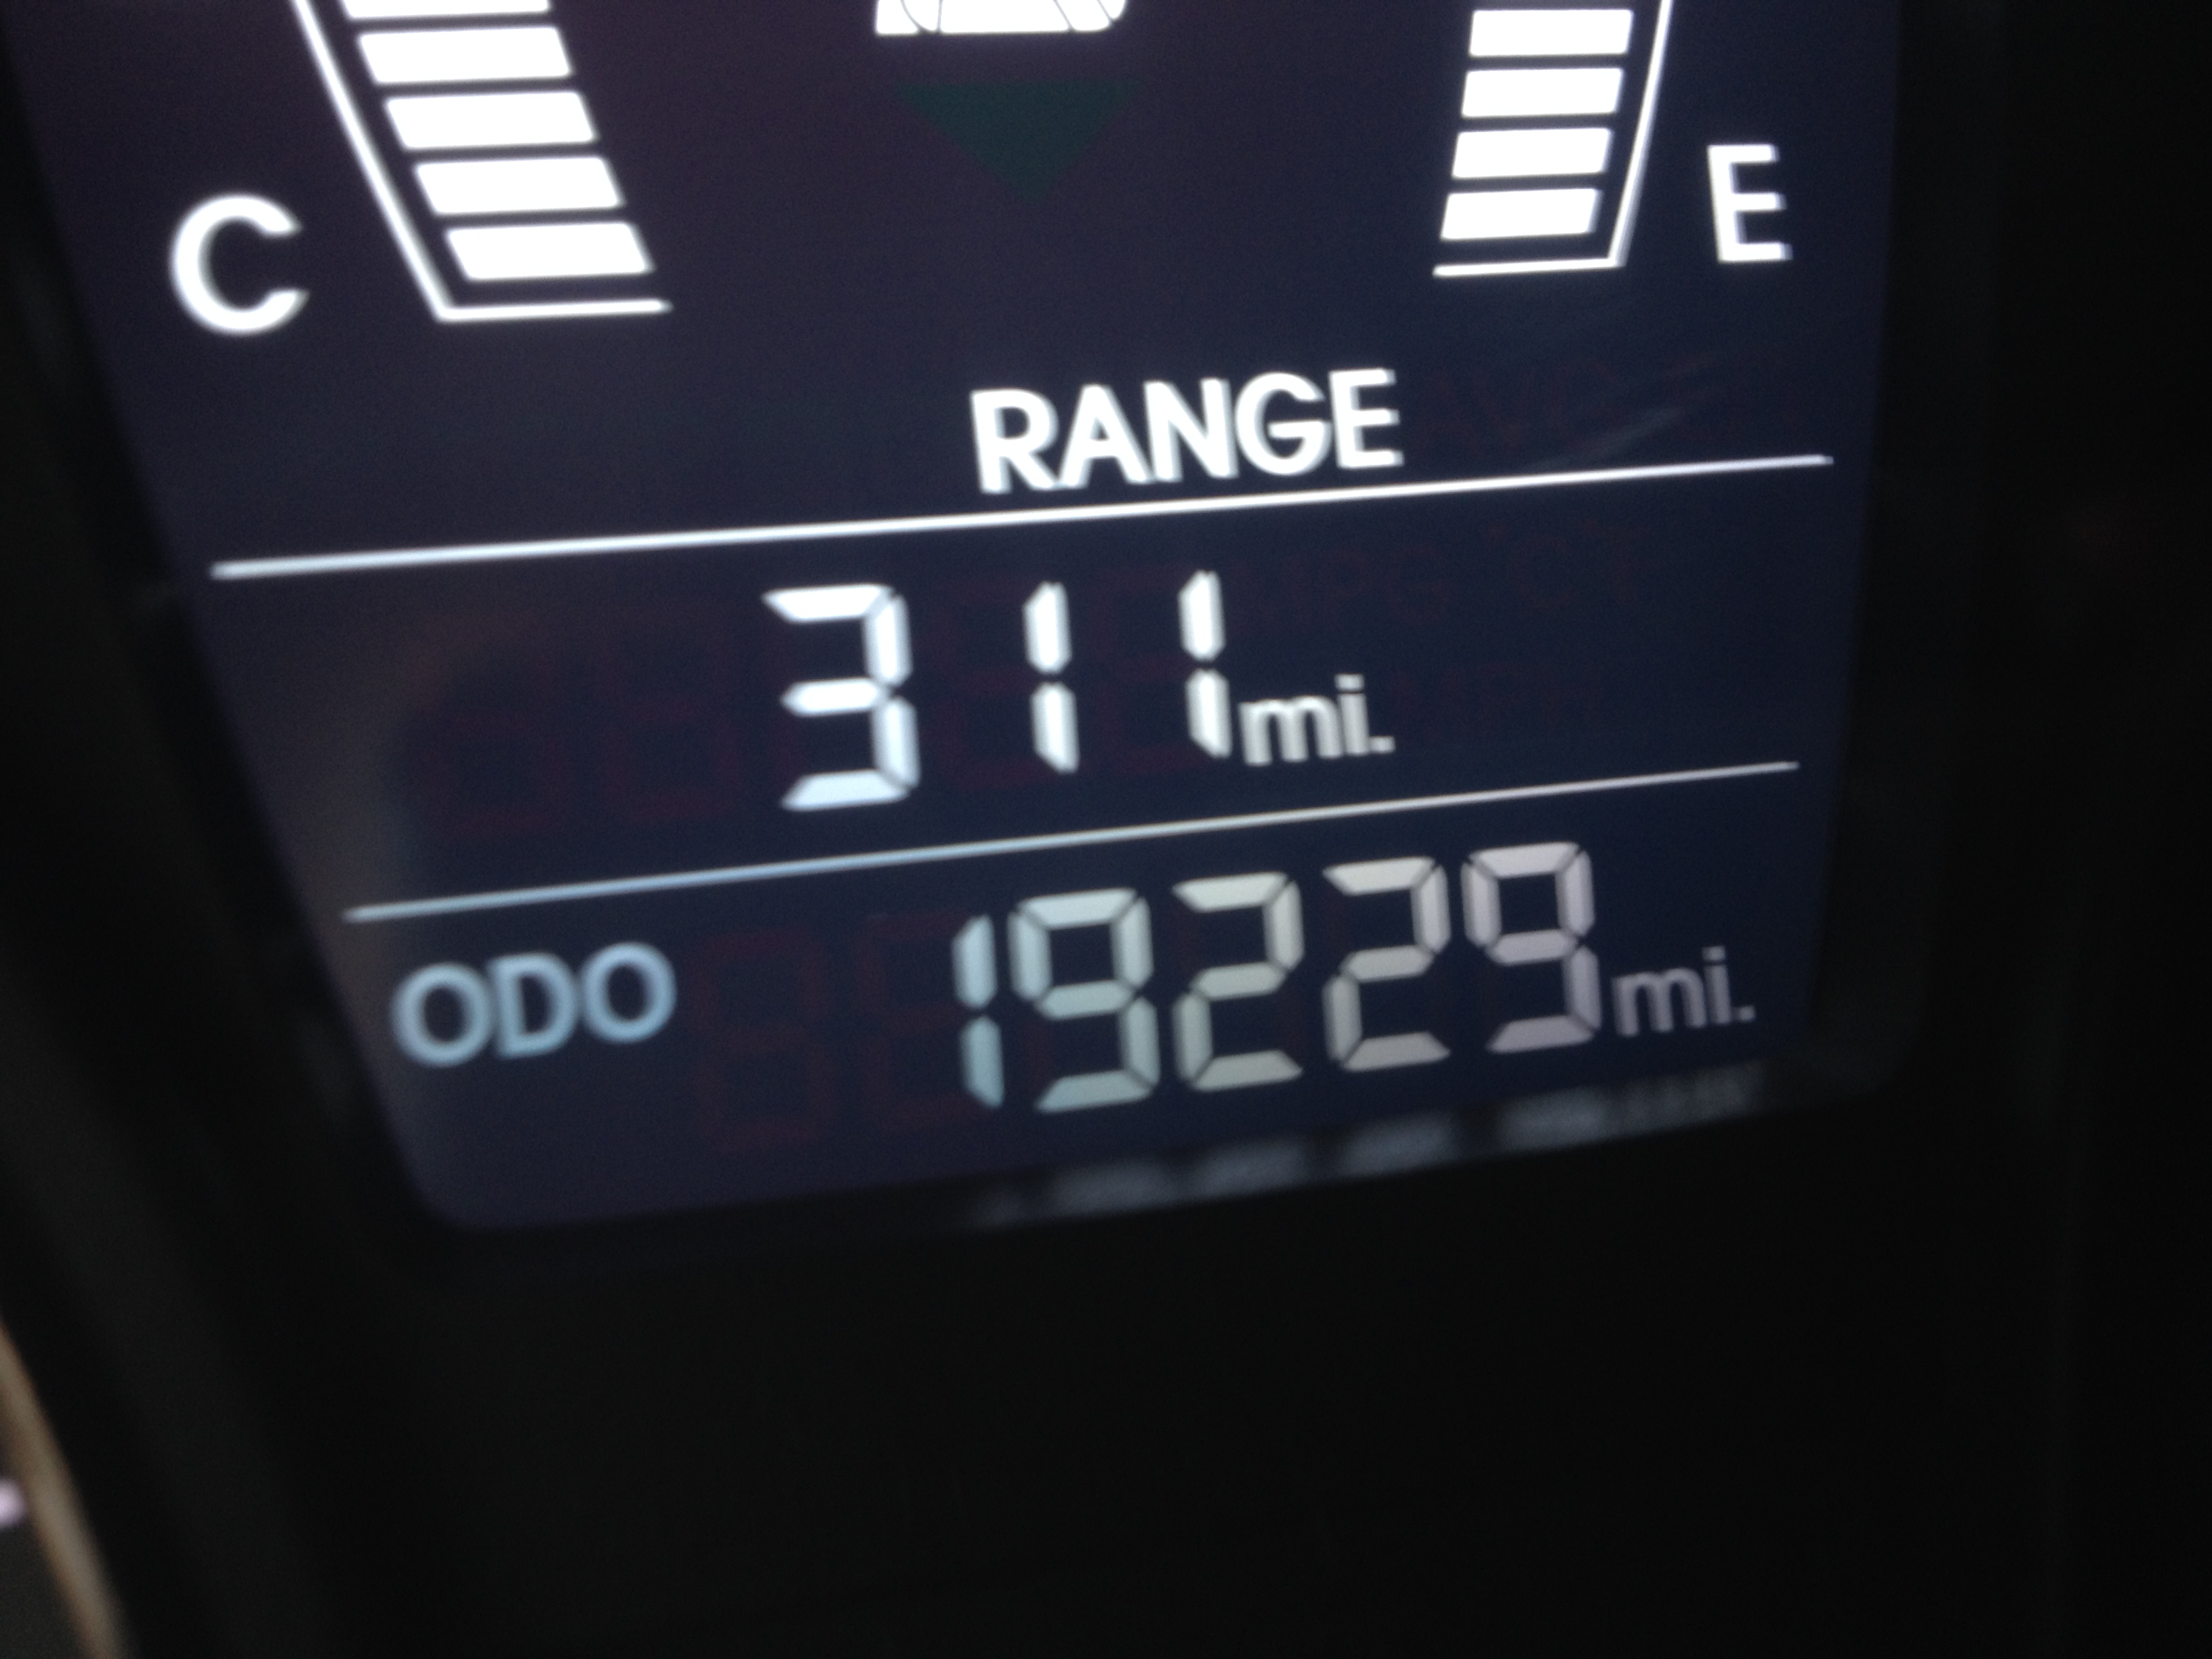
Being a professional “Noticer of Math Things” a few miles later I noticed this:
What do you notice?
What does that make you think?
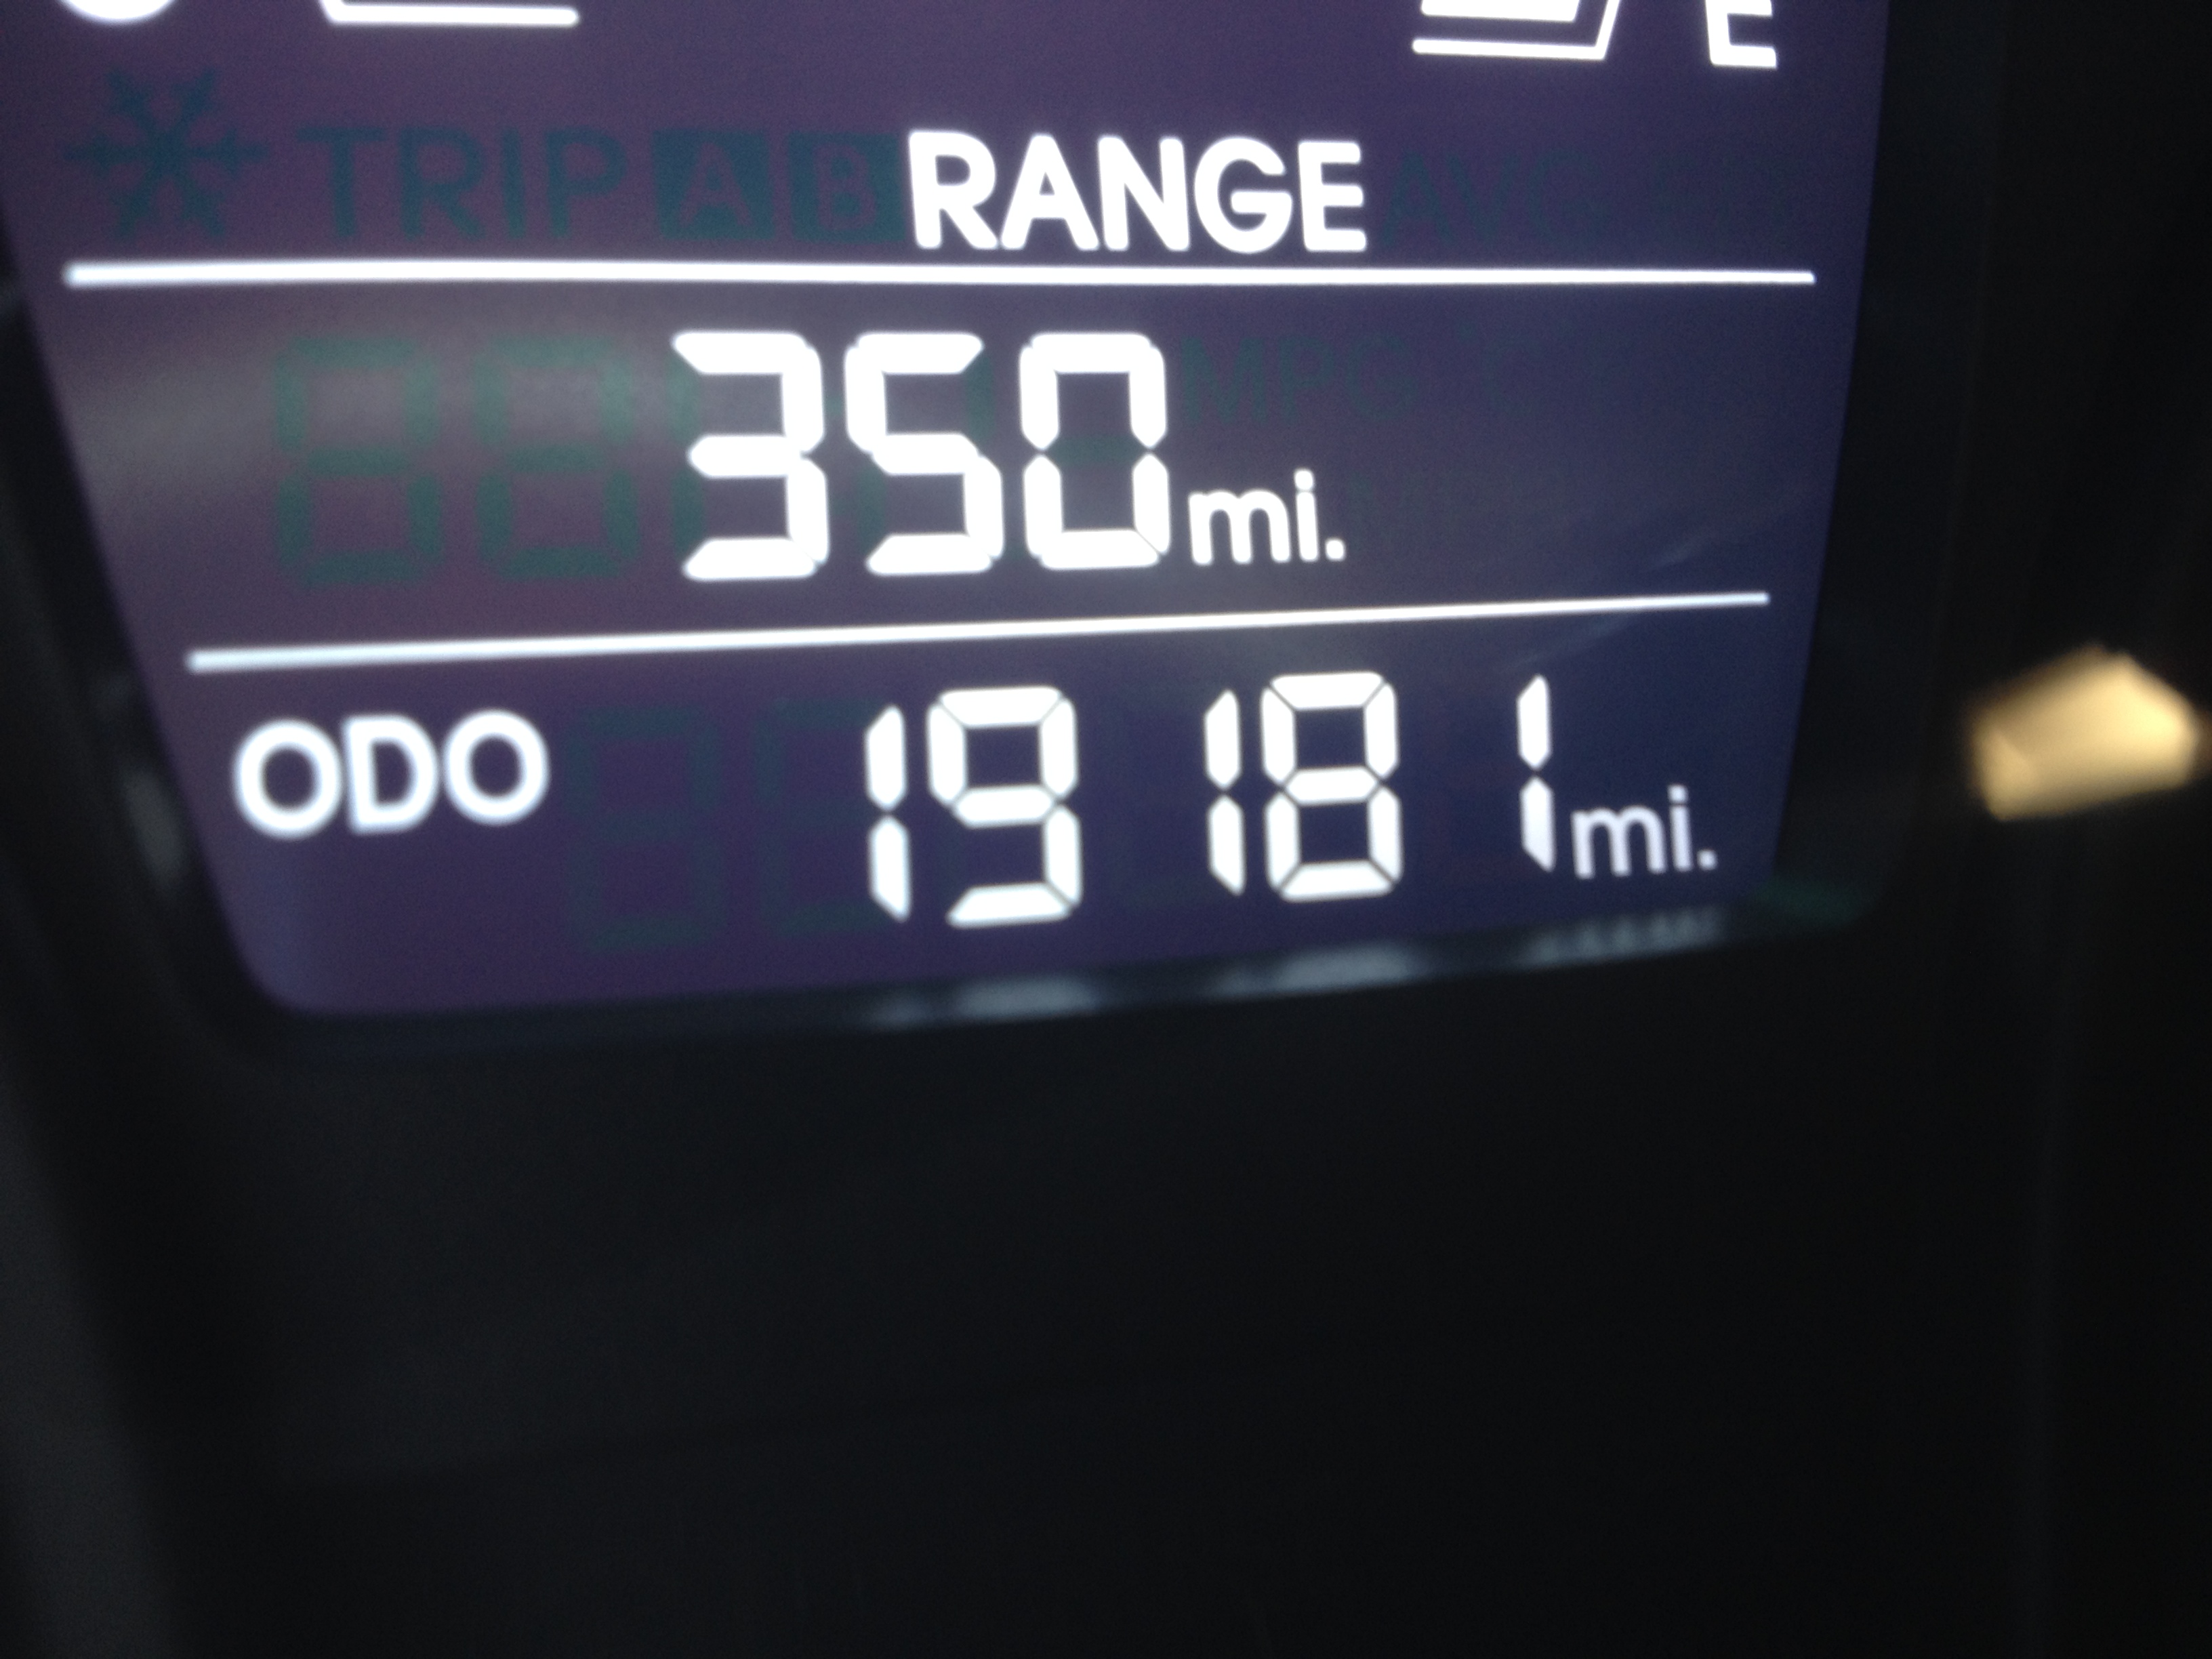
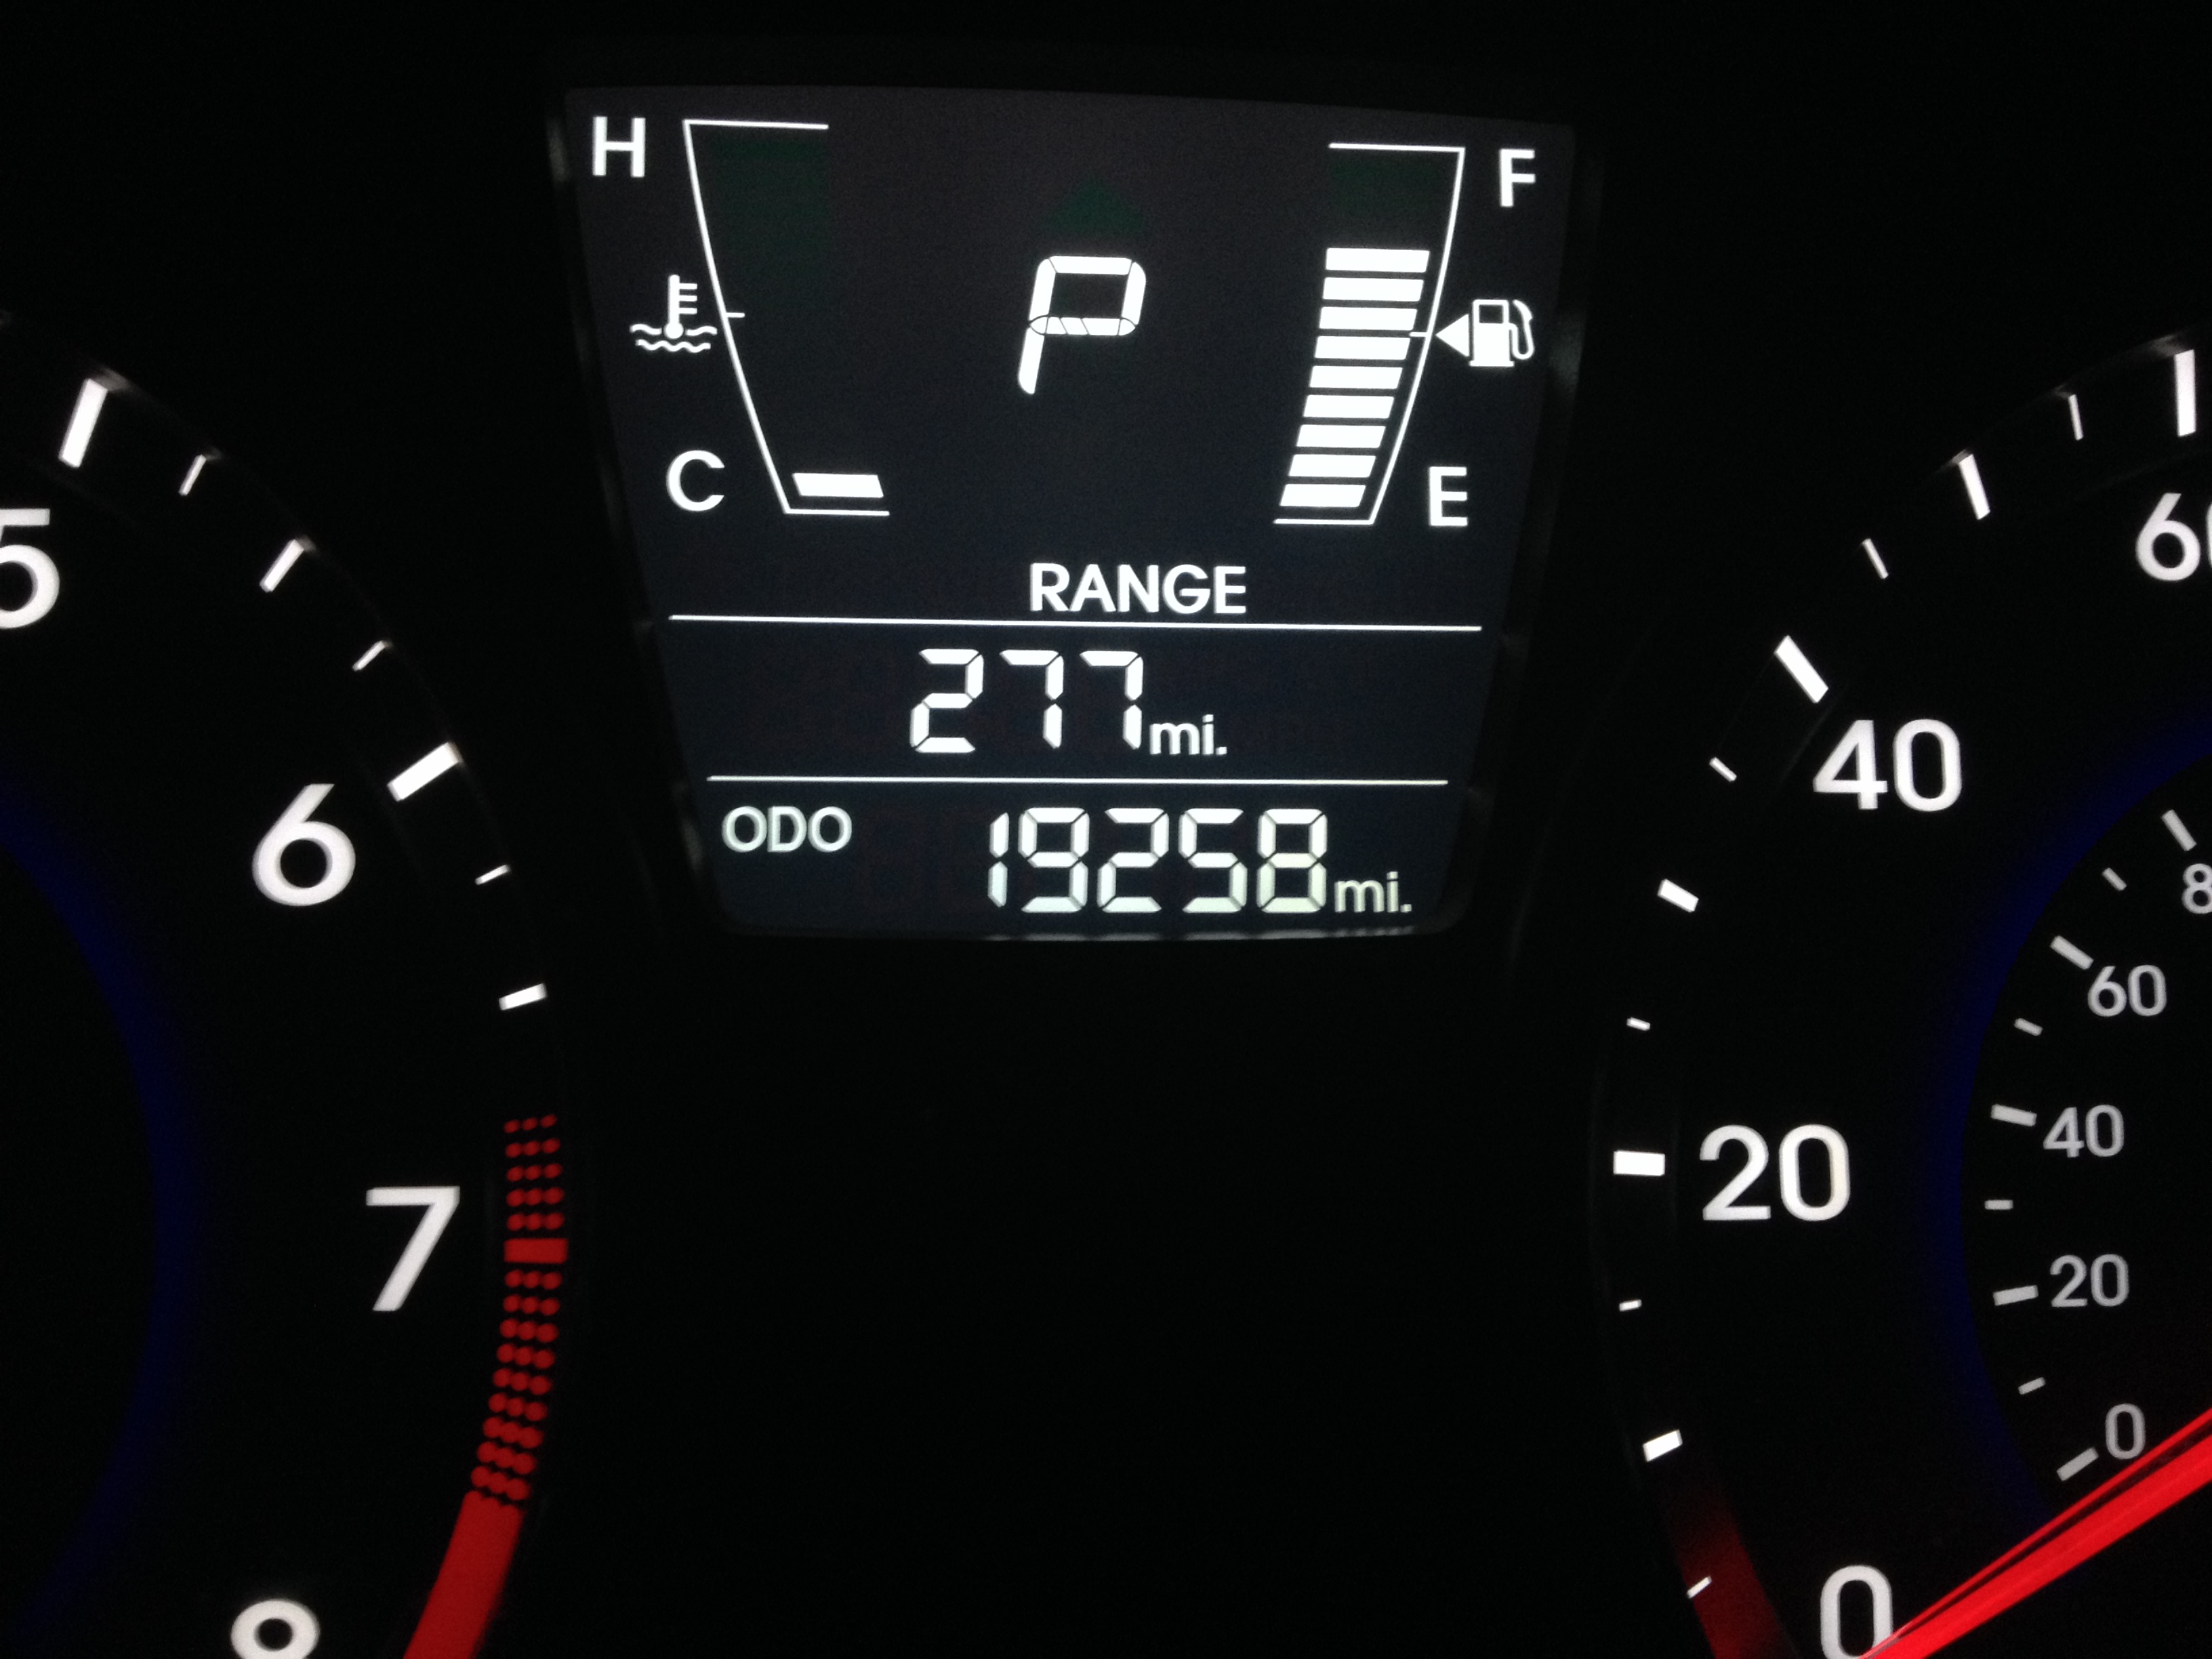
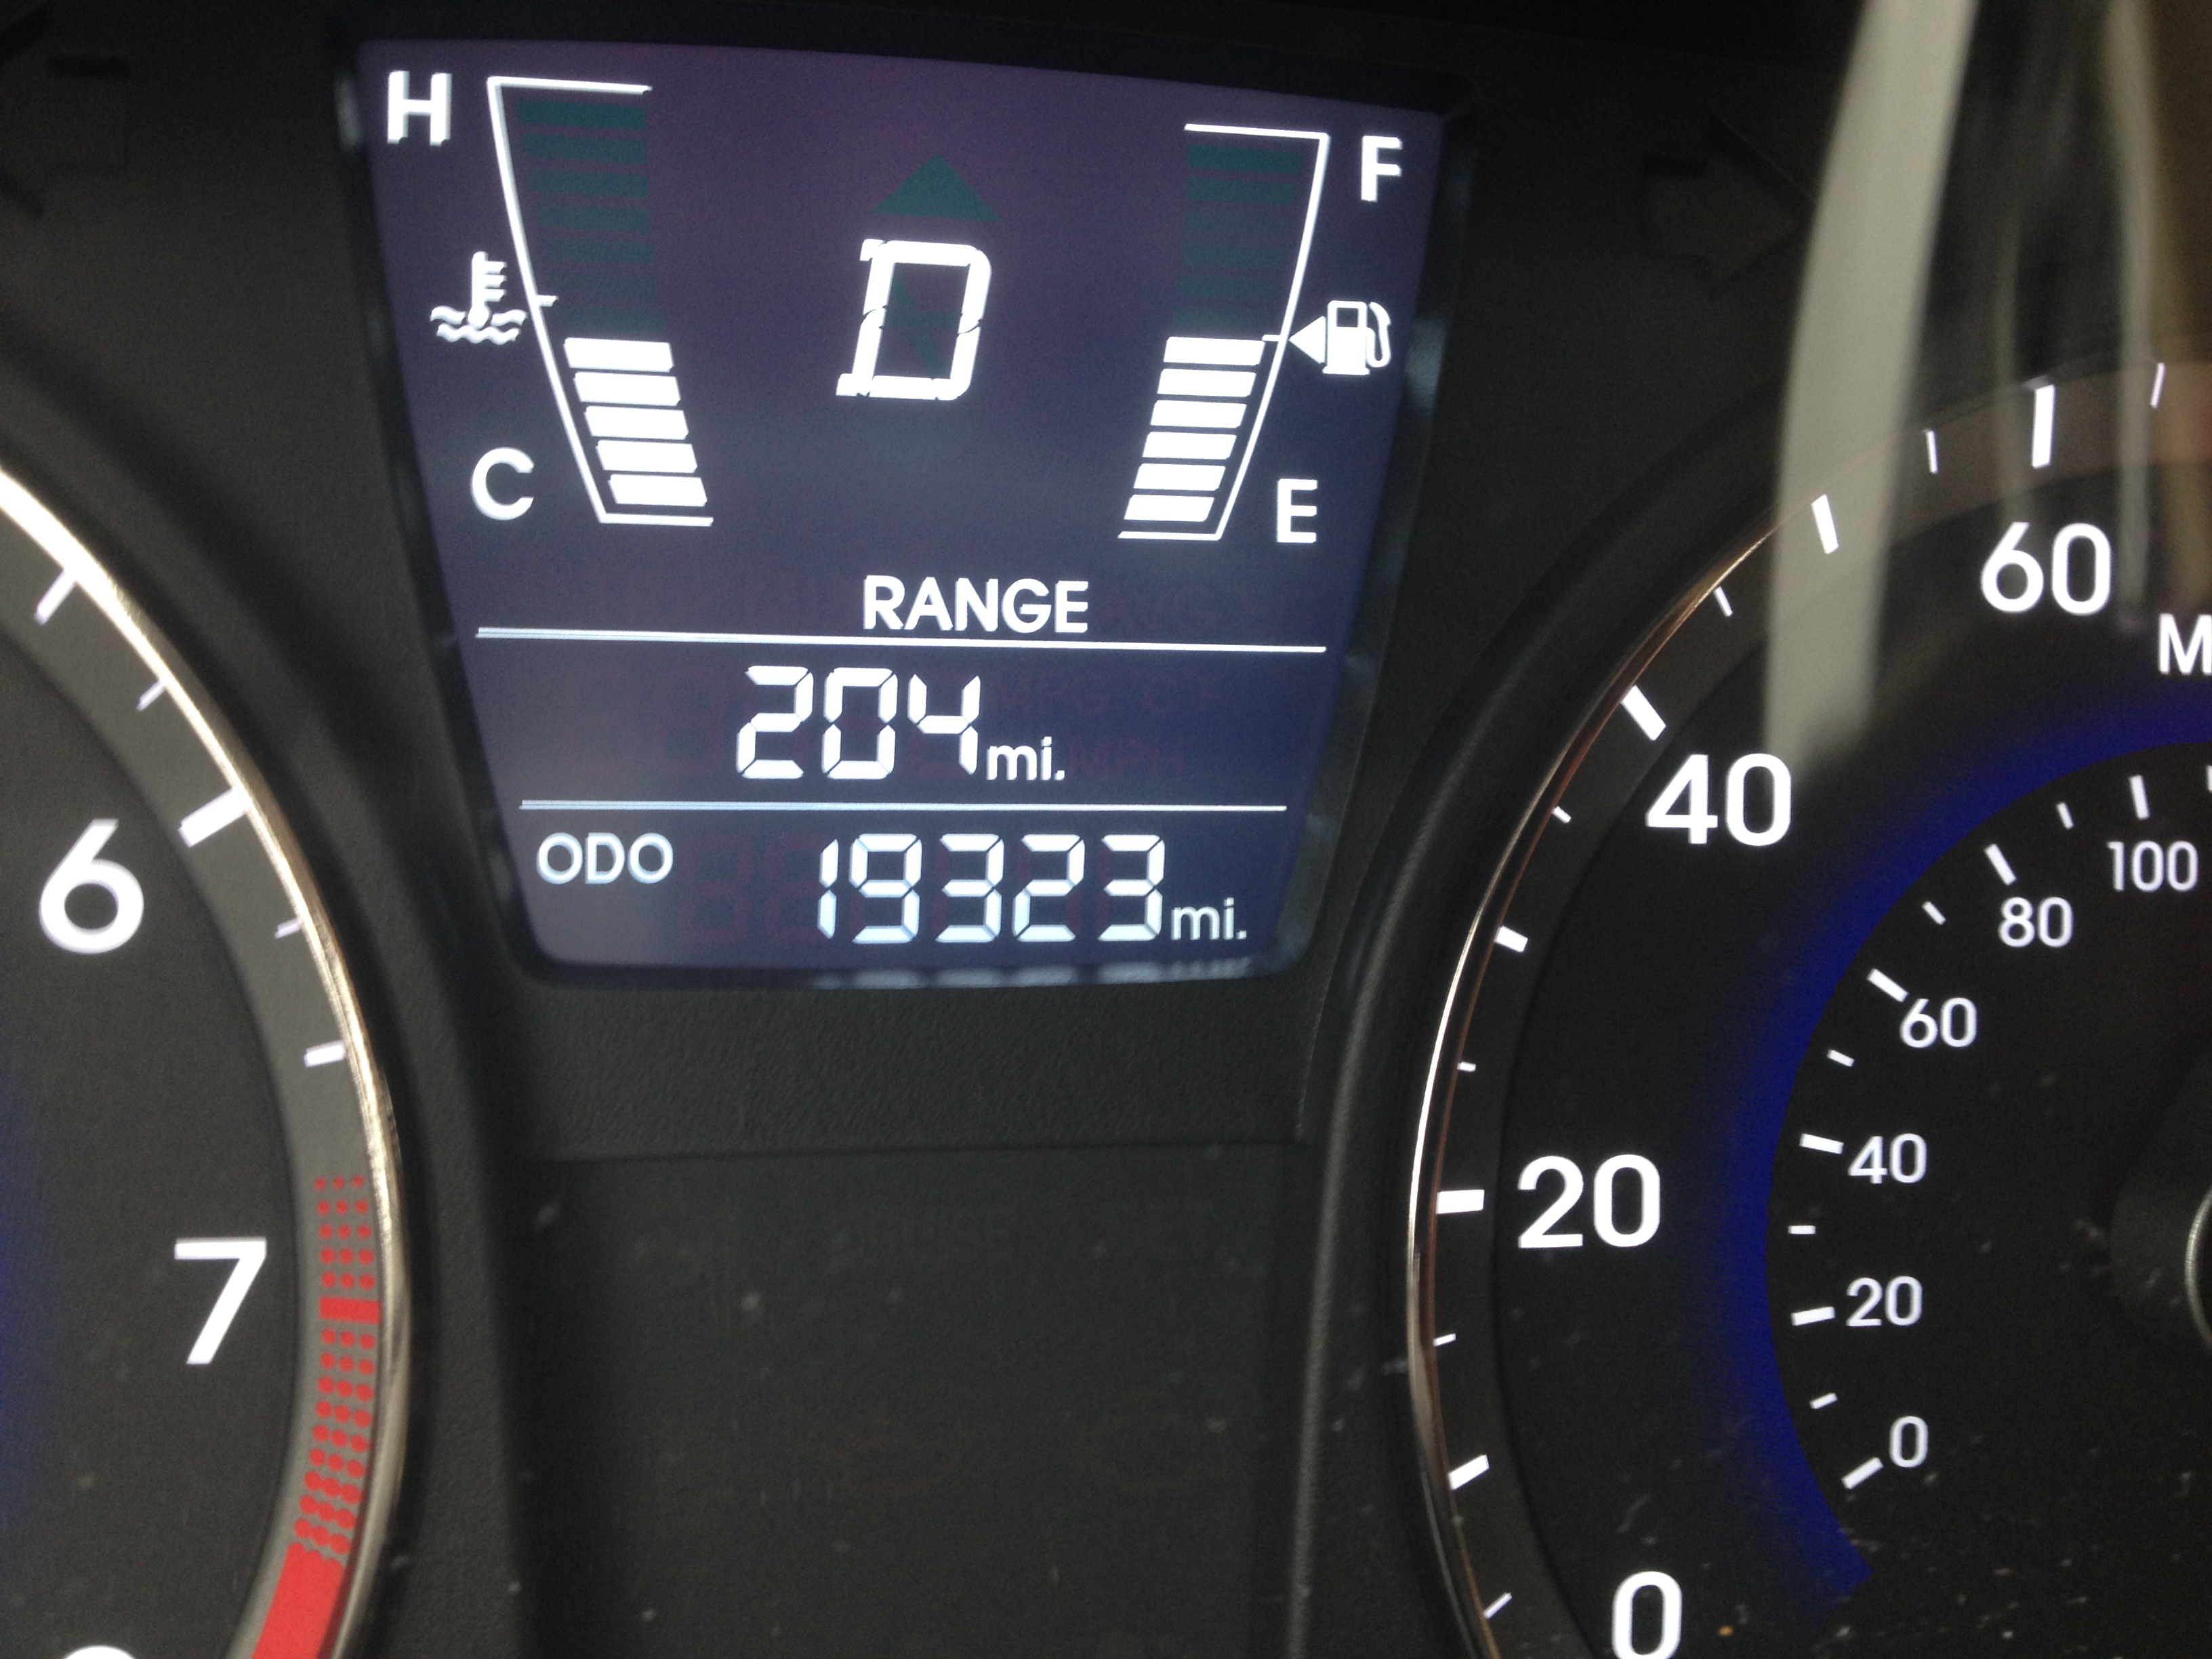
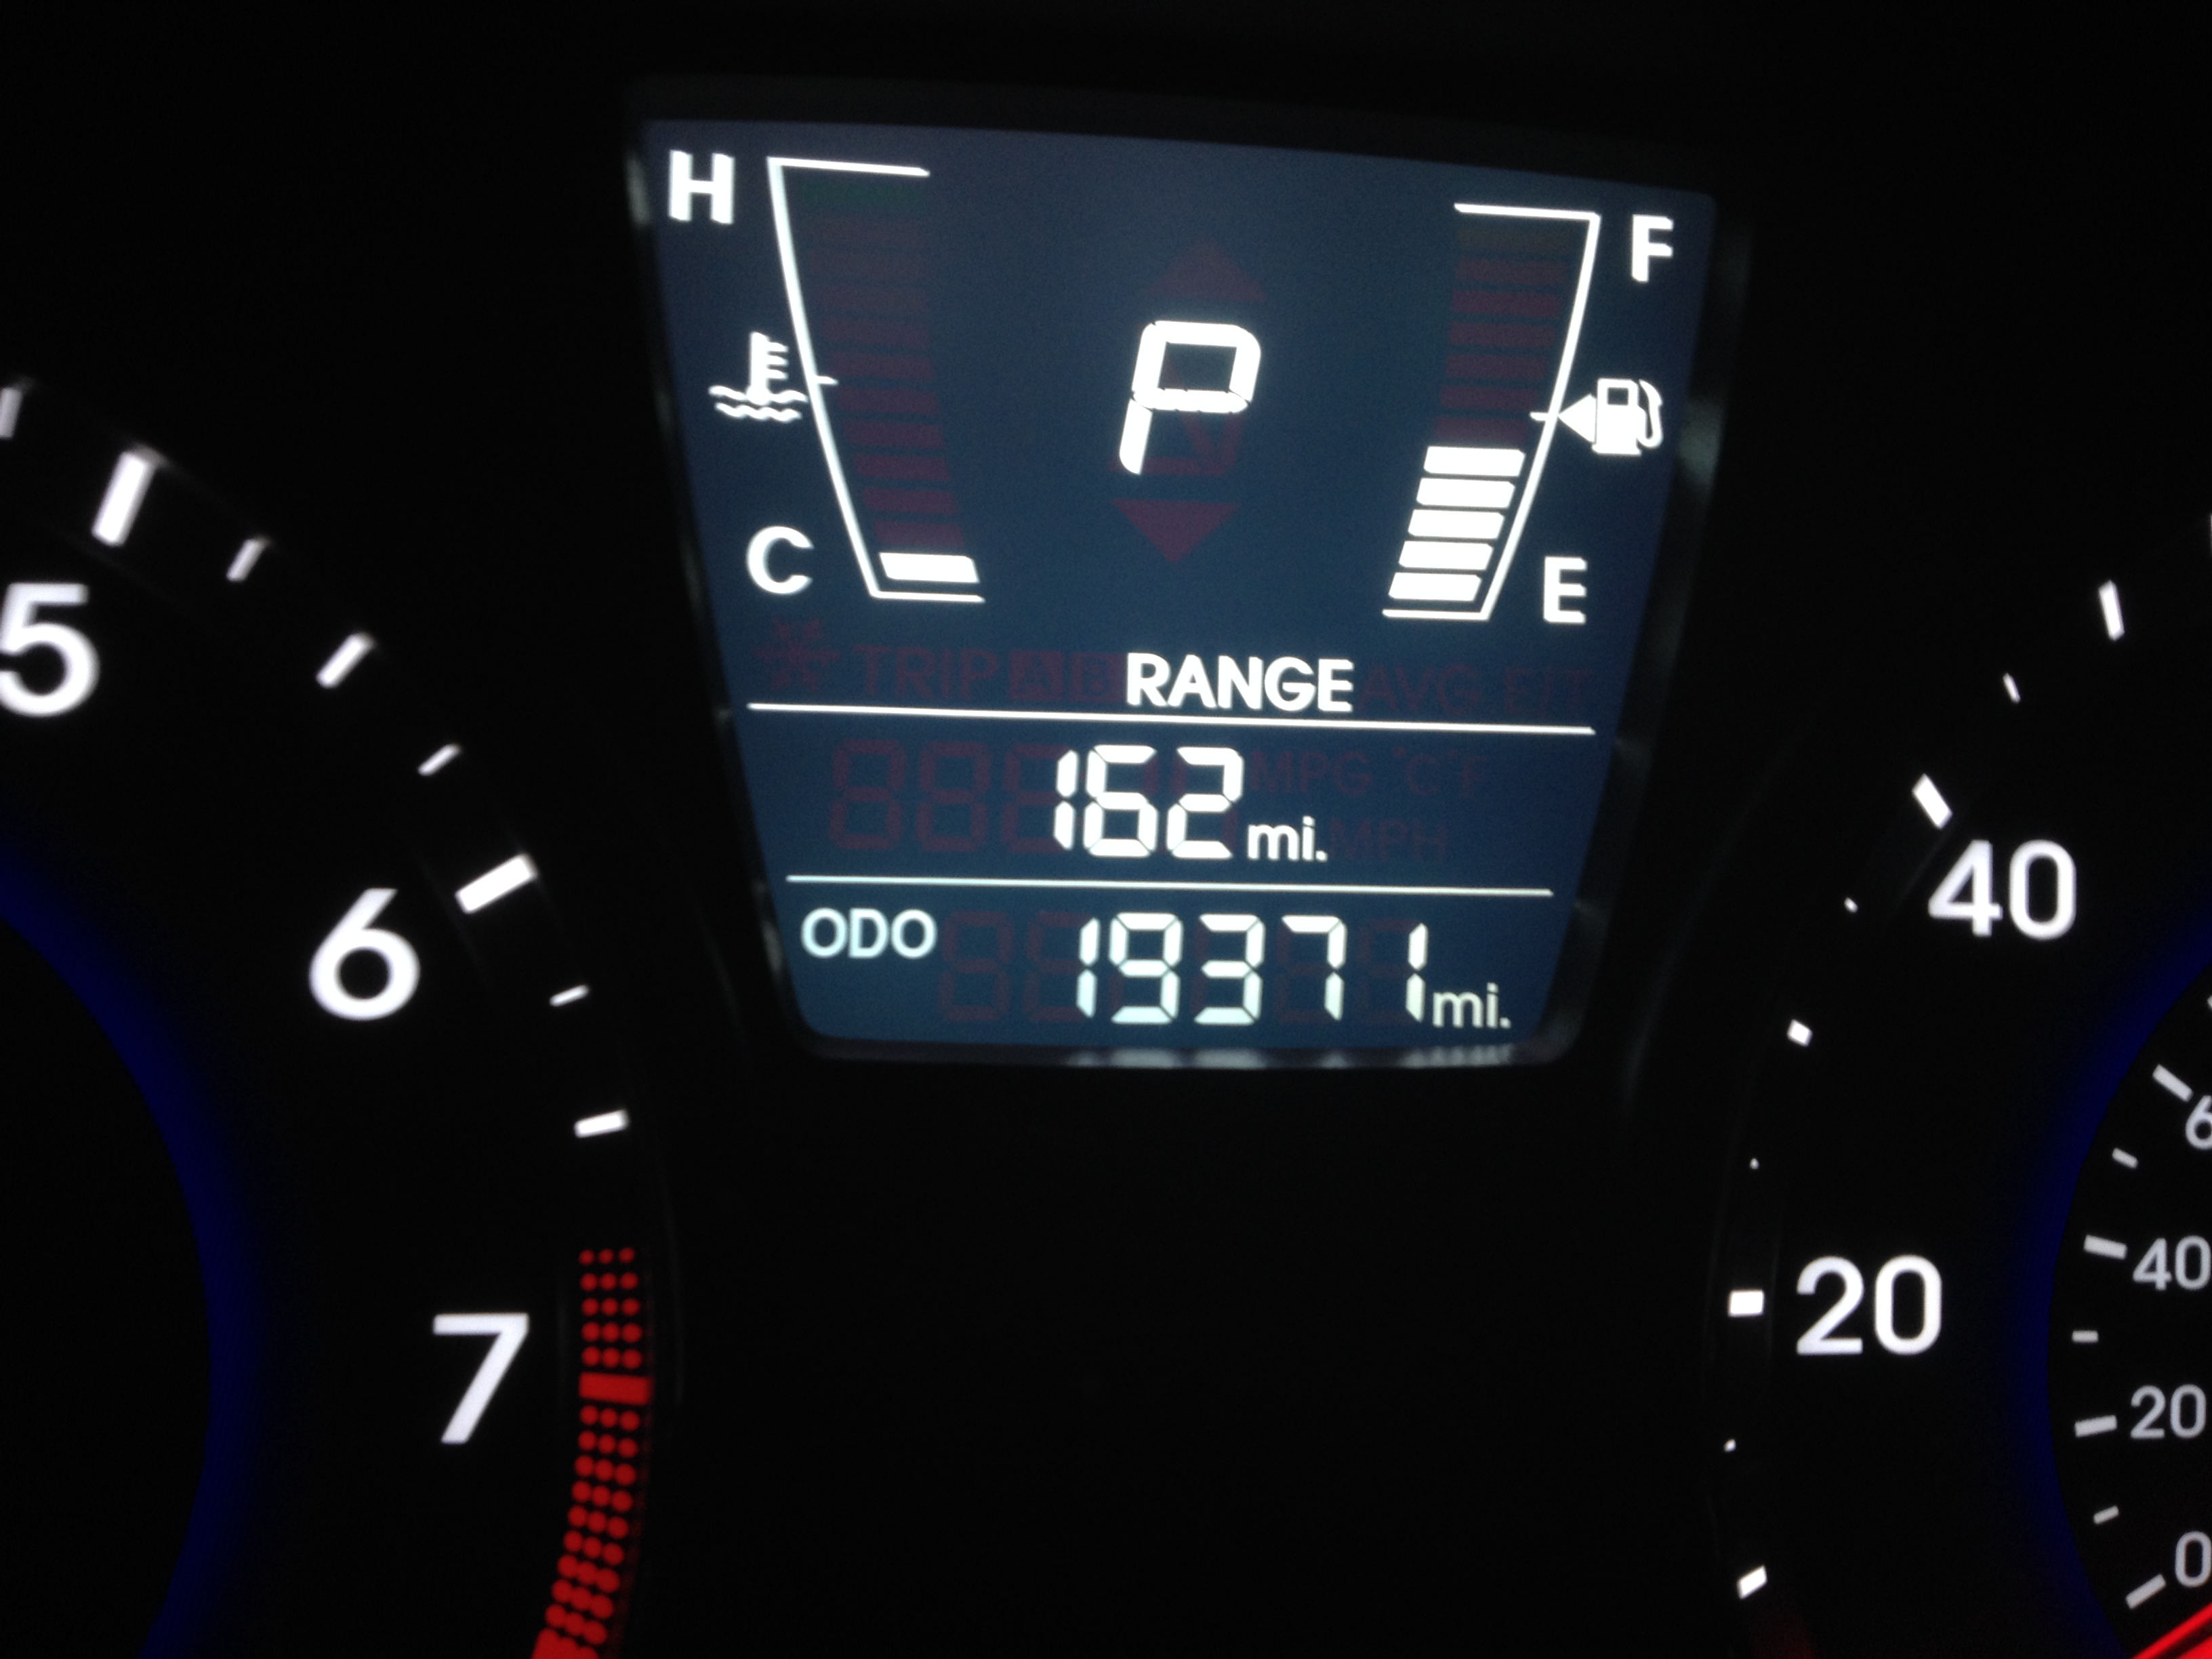
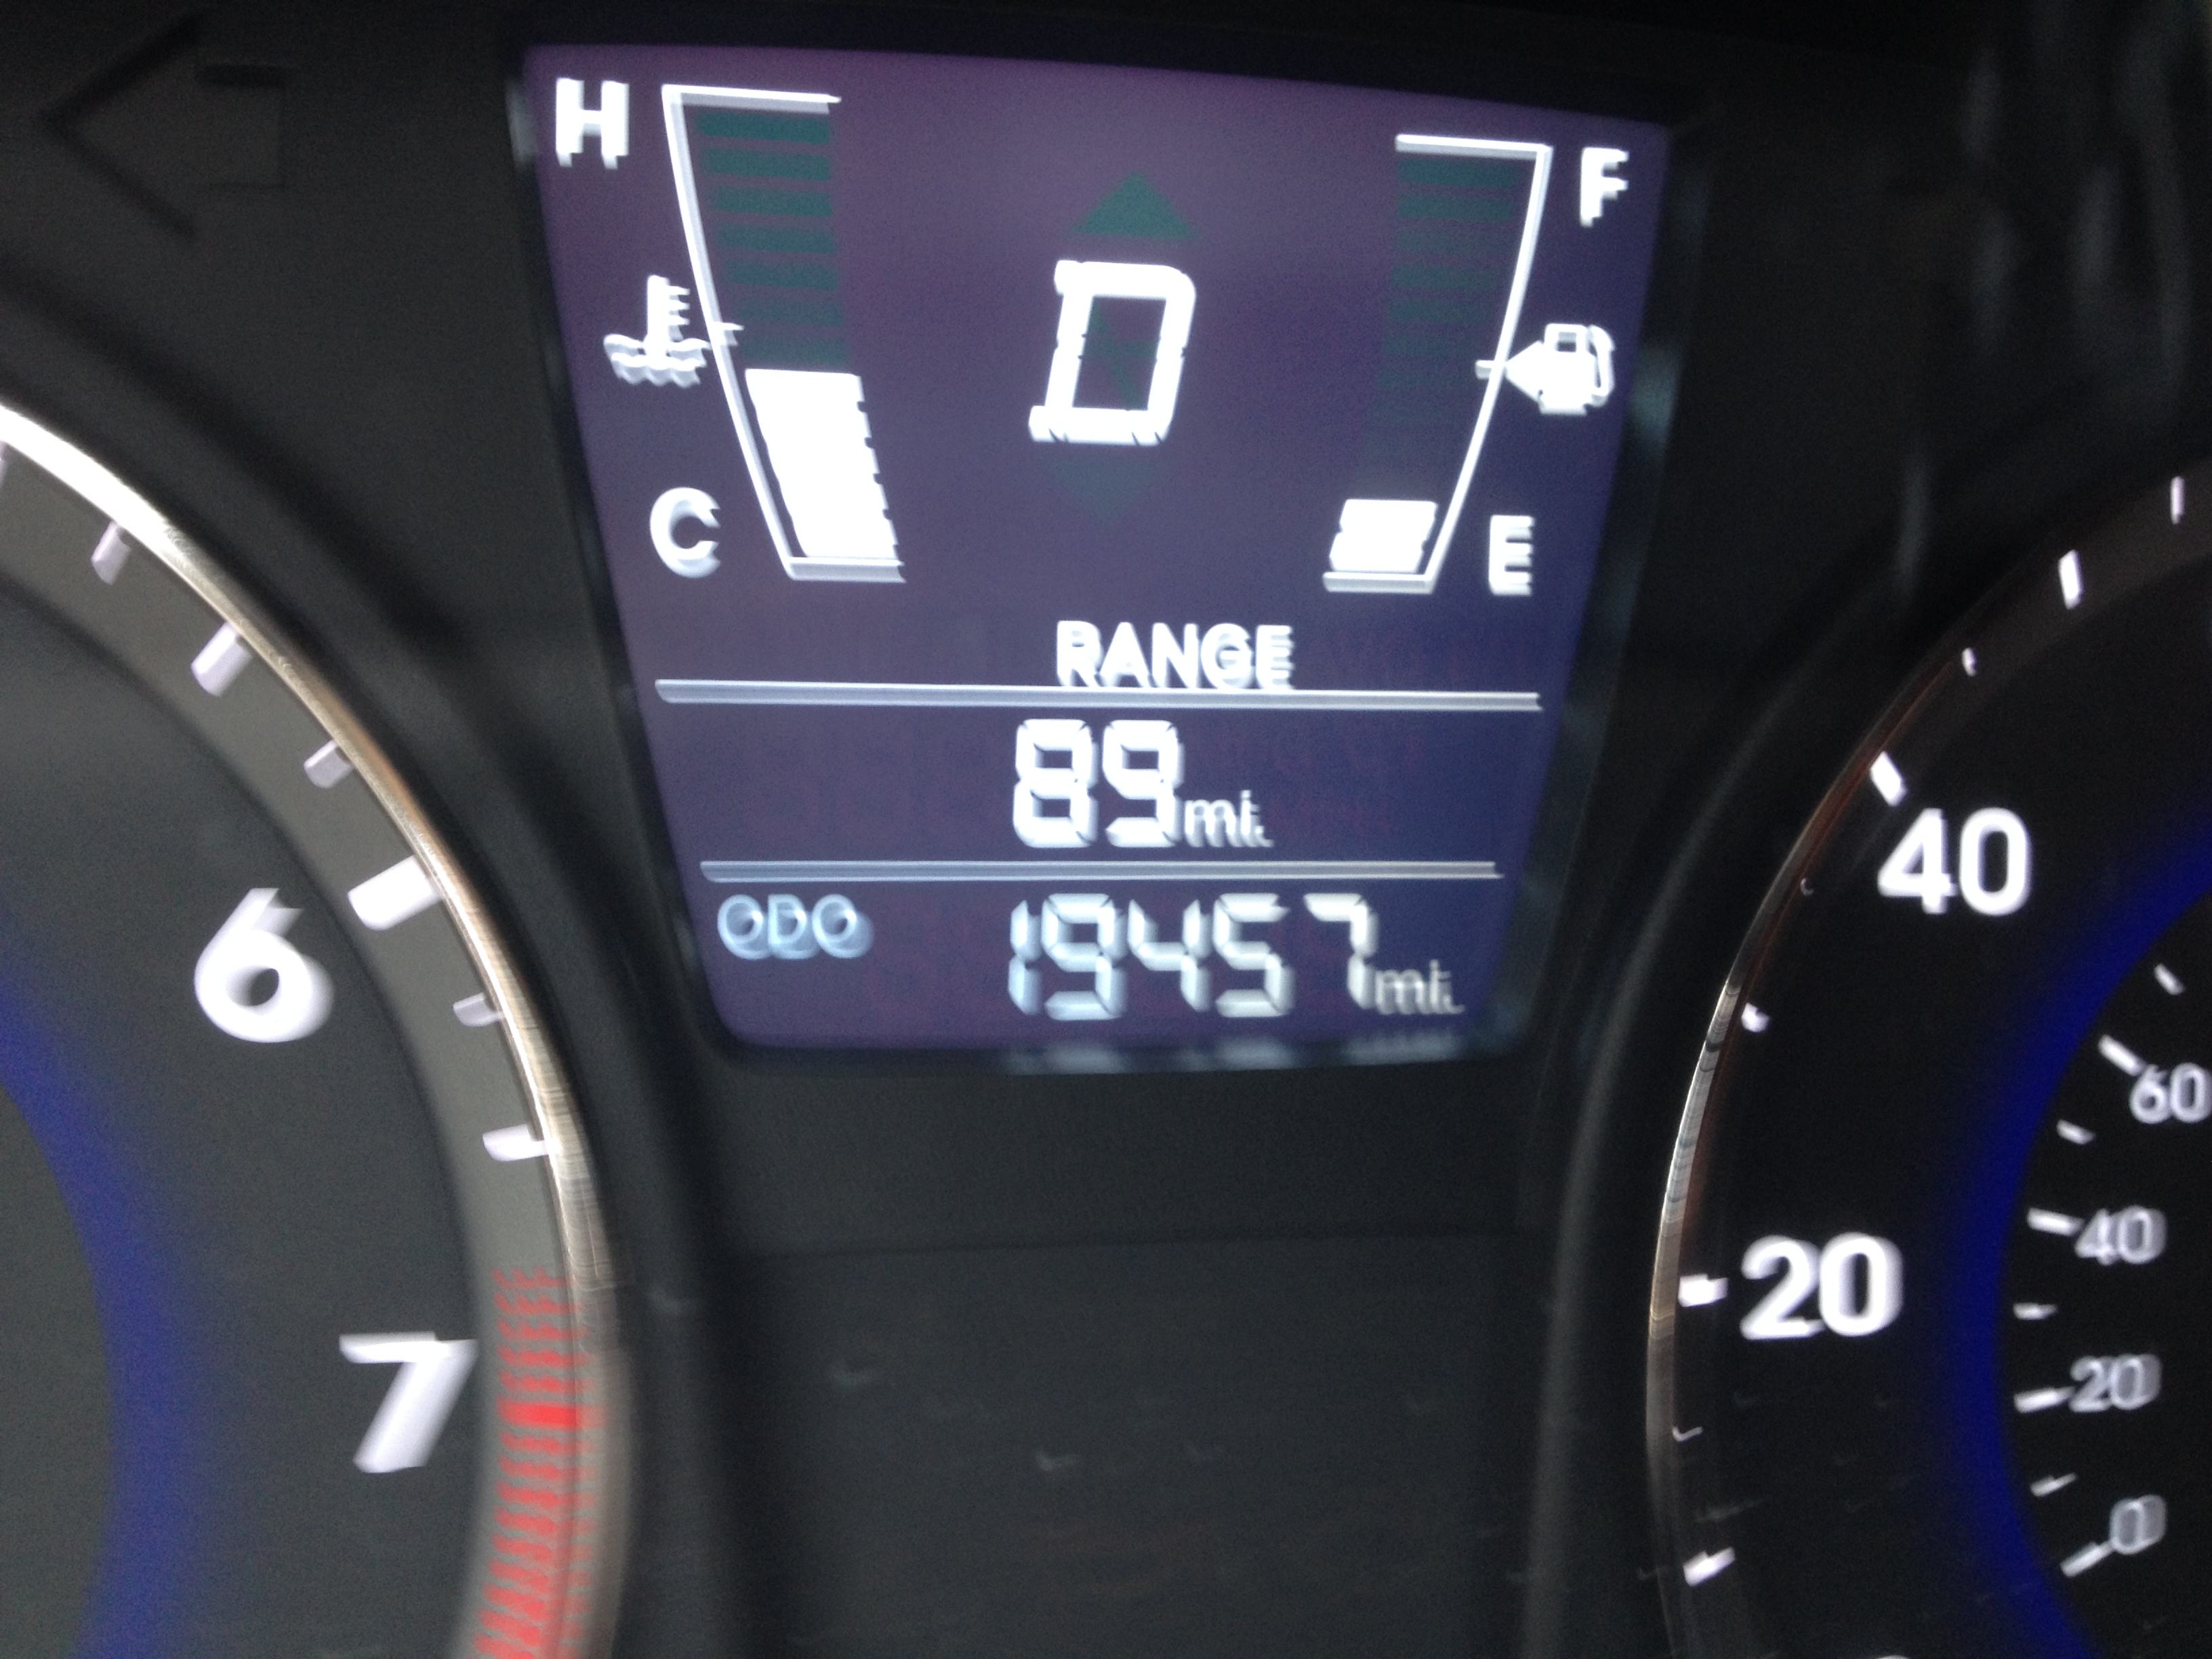
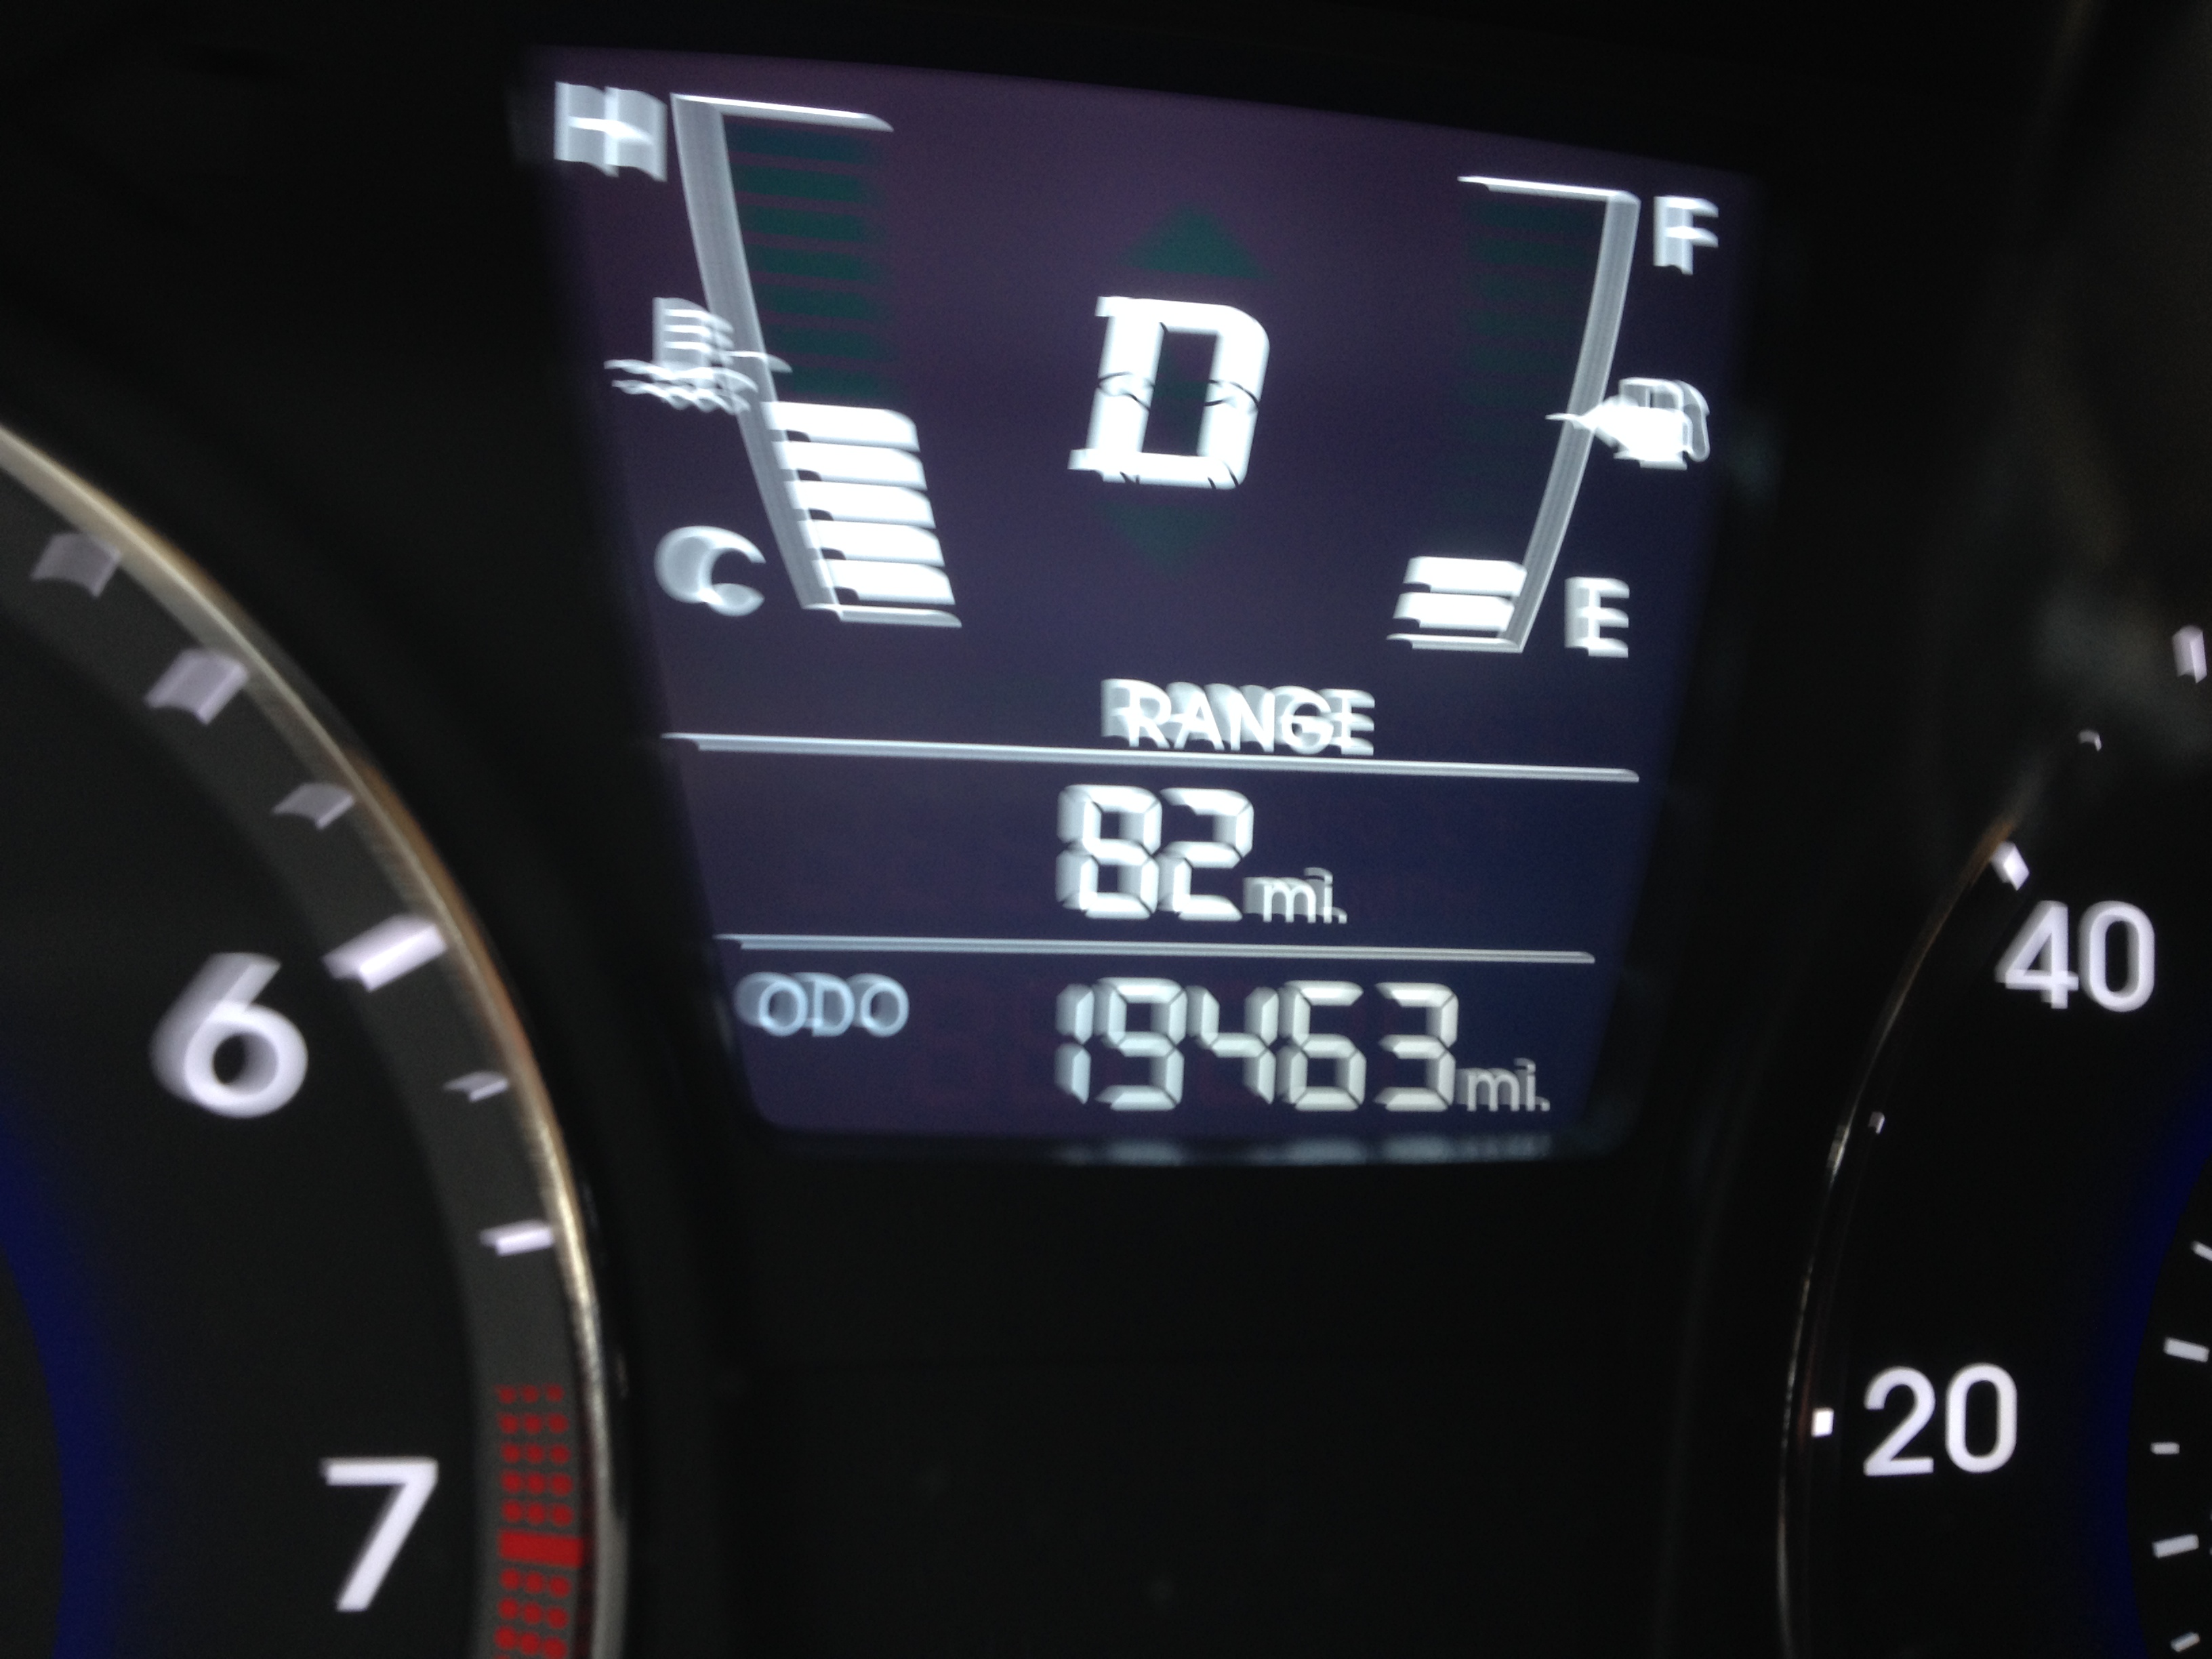
If I show you these…


Now what do you think?
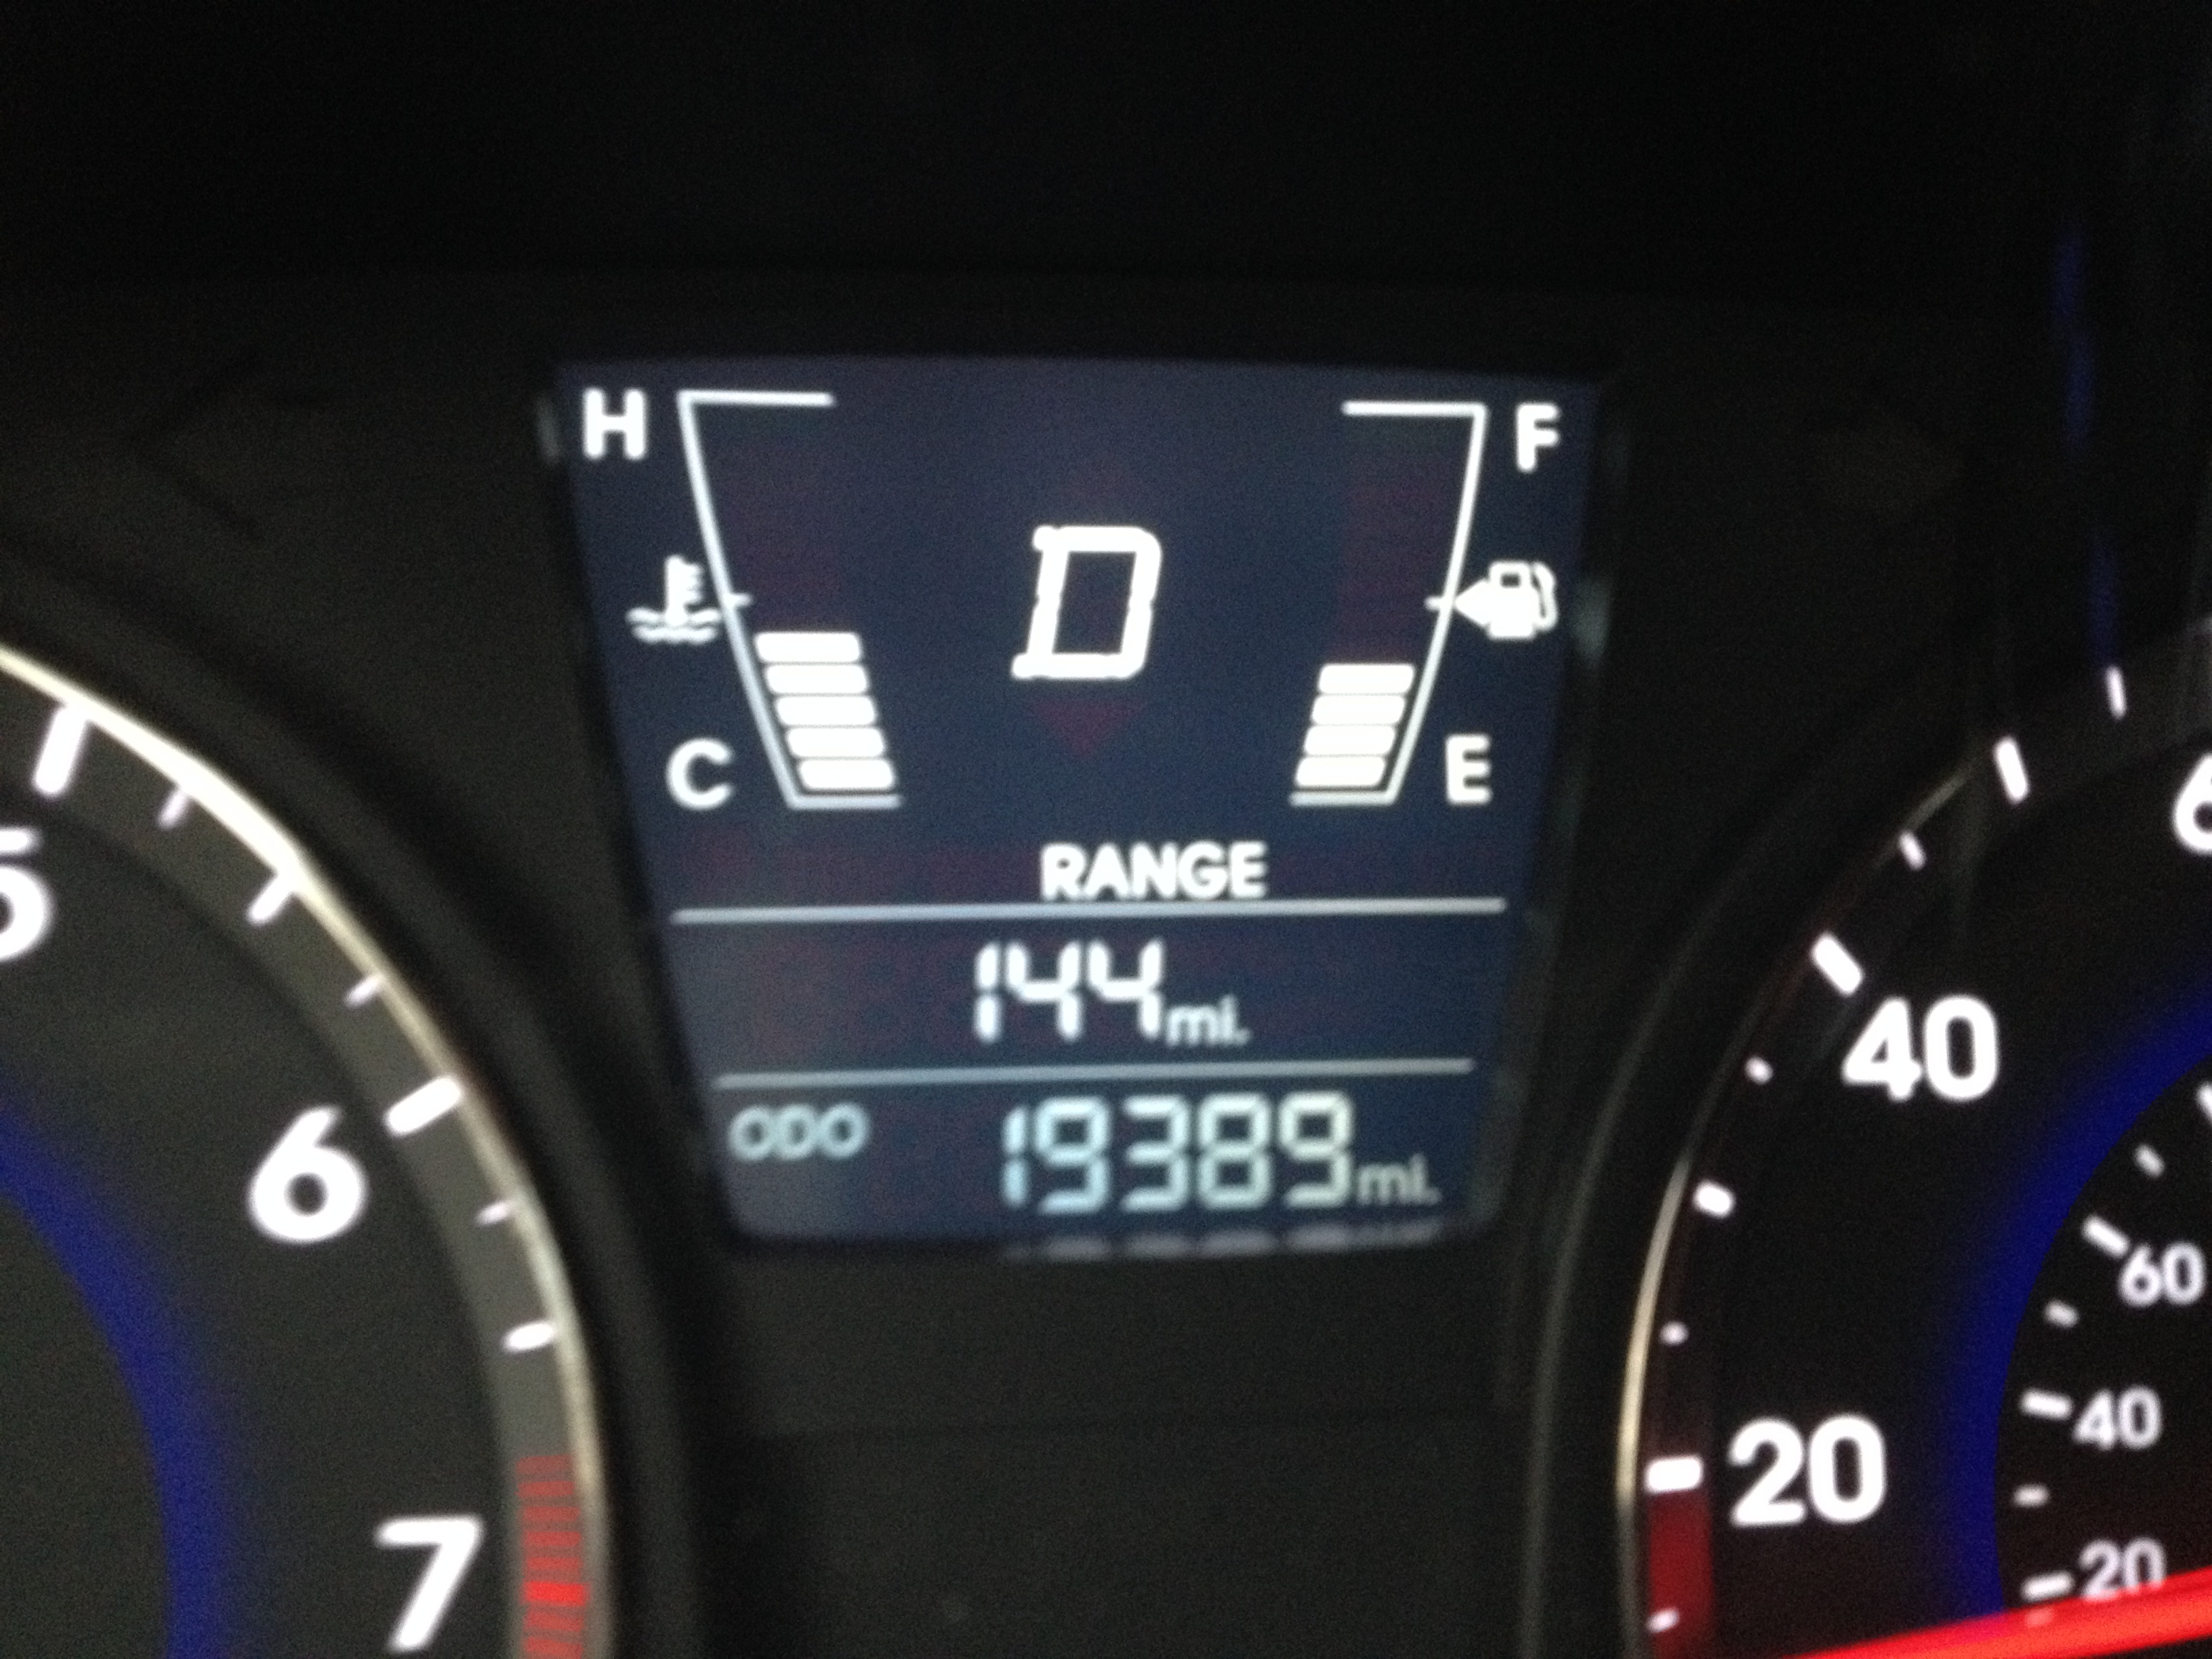
ACT 2: The Information.
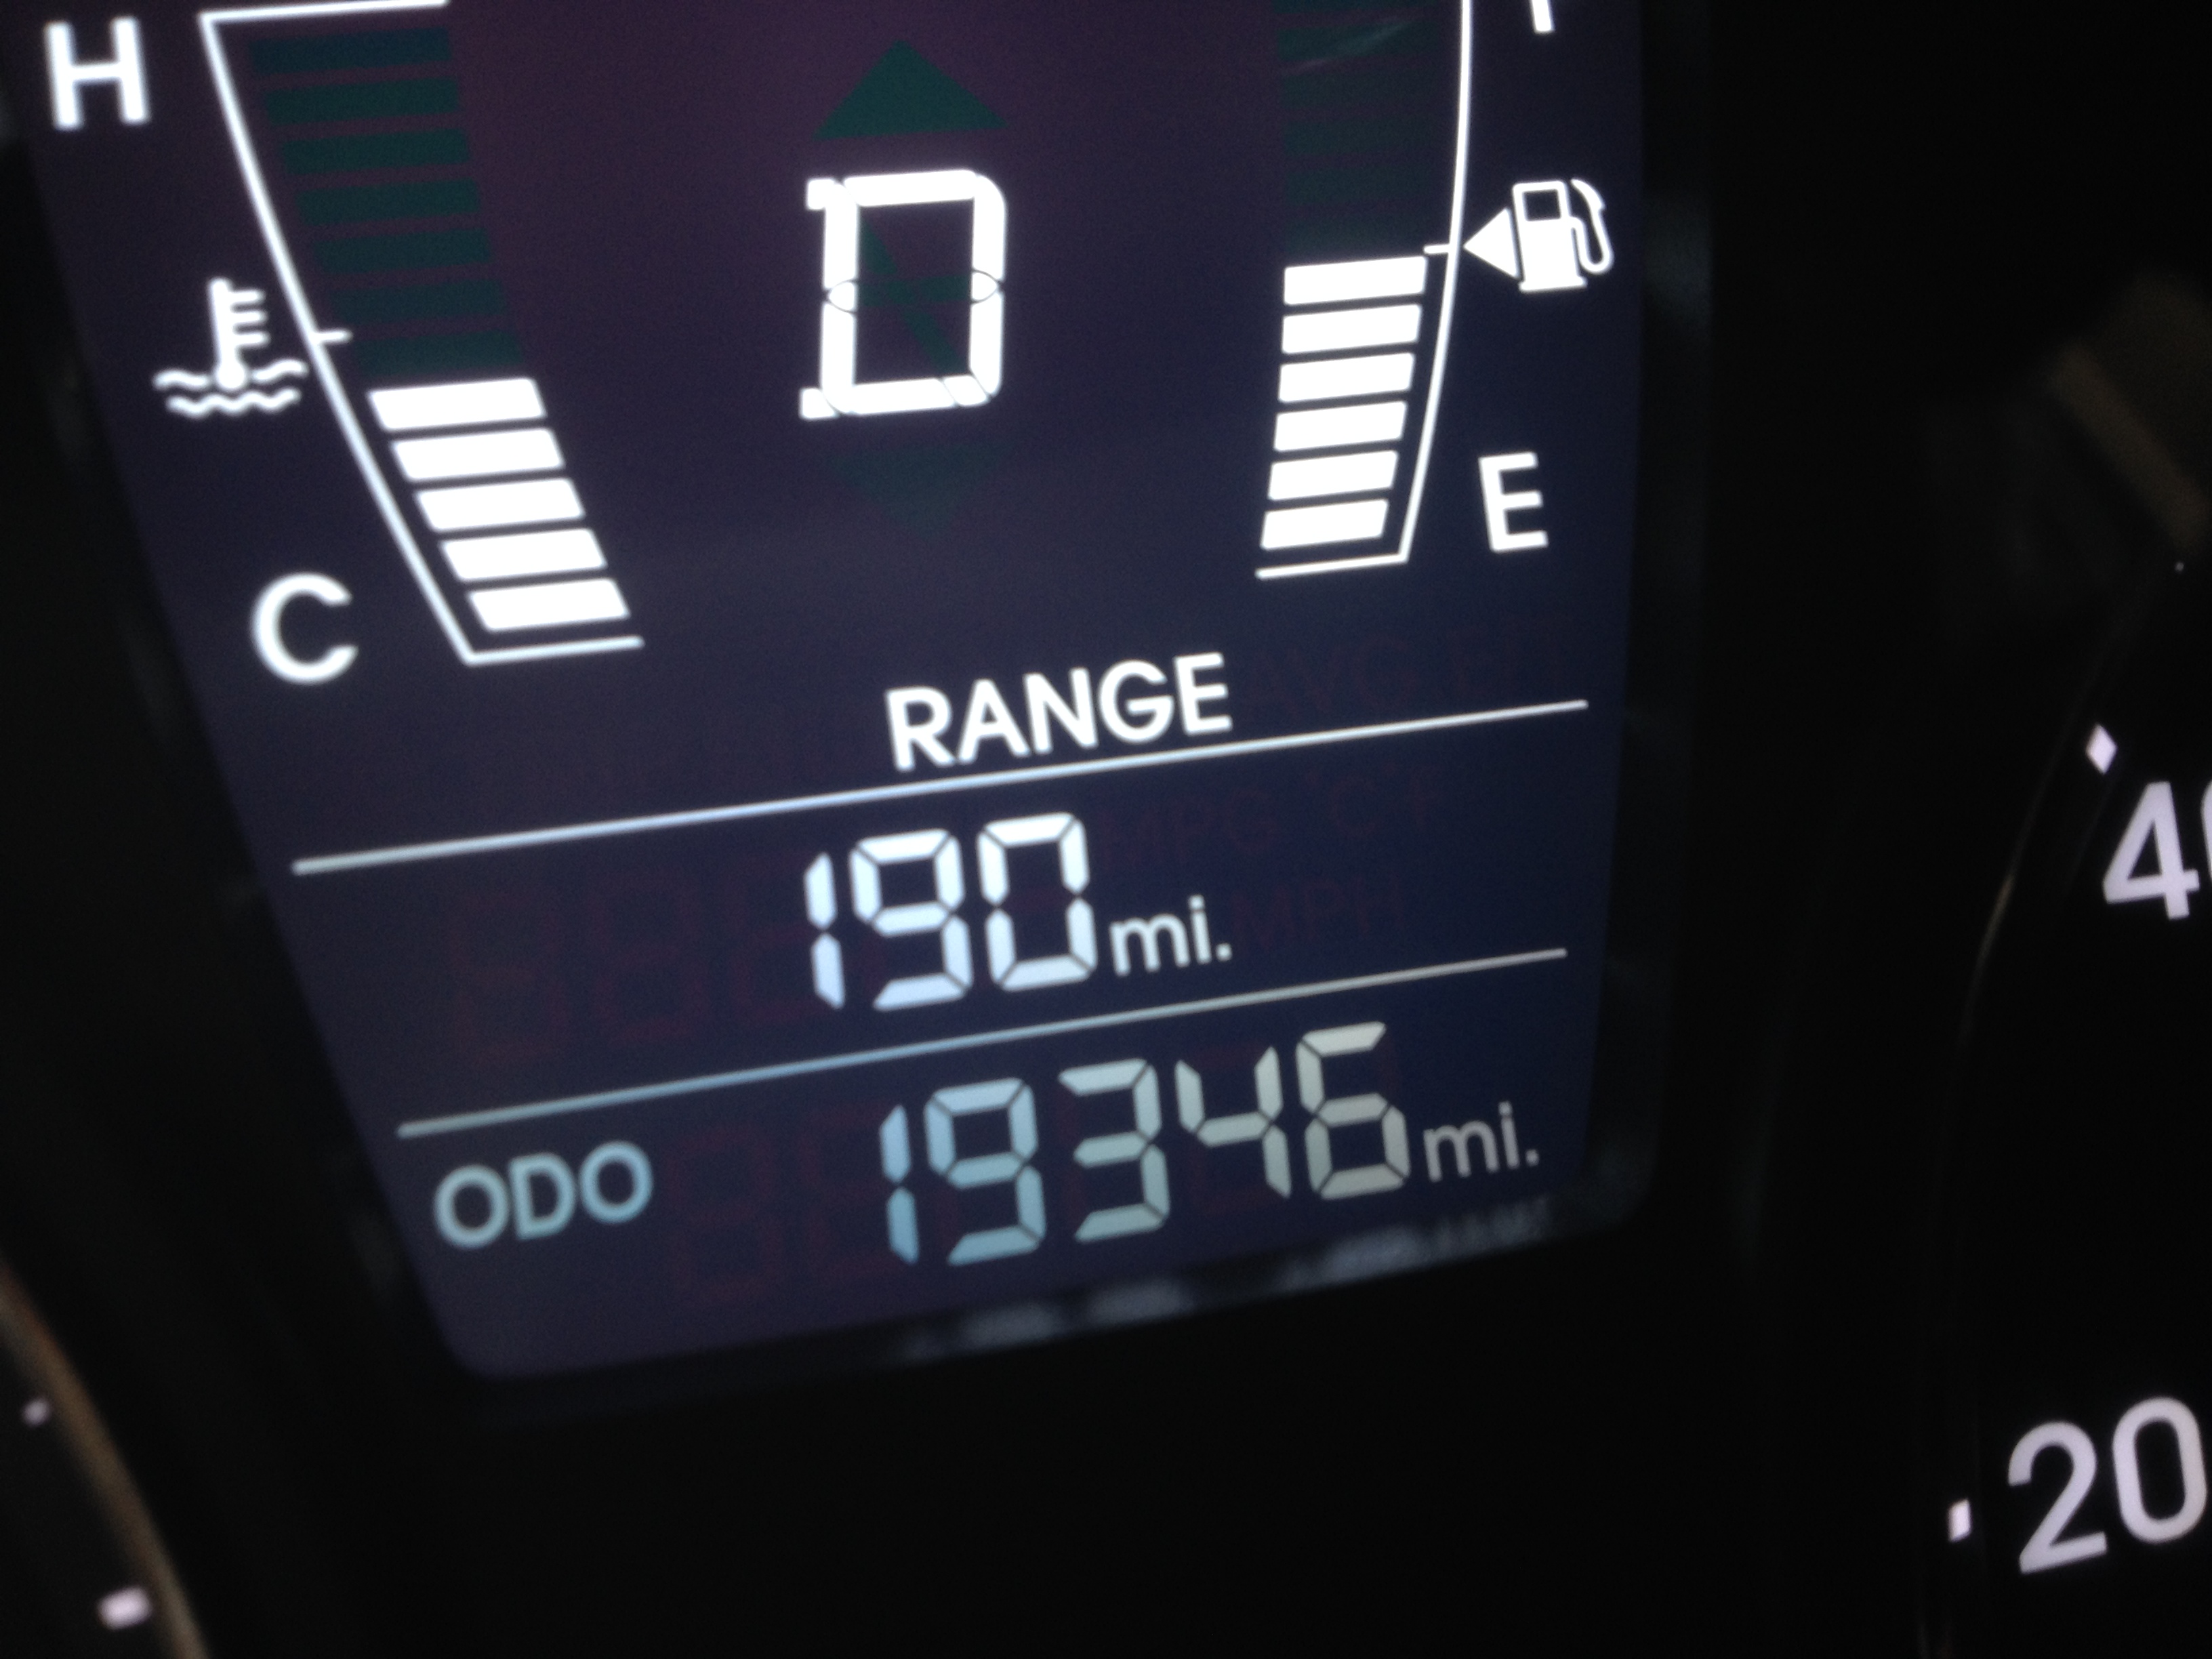
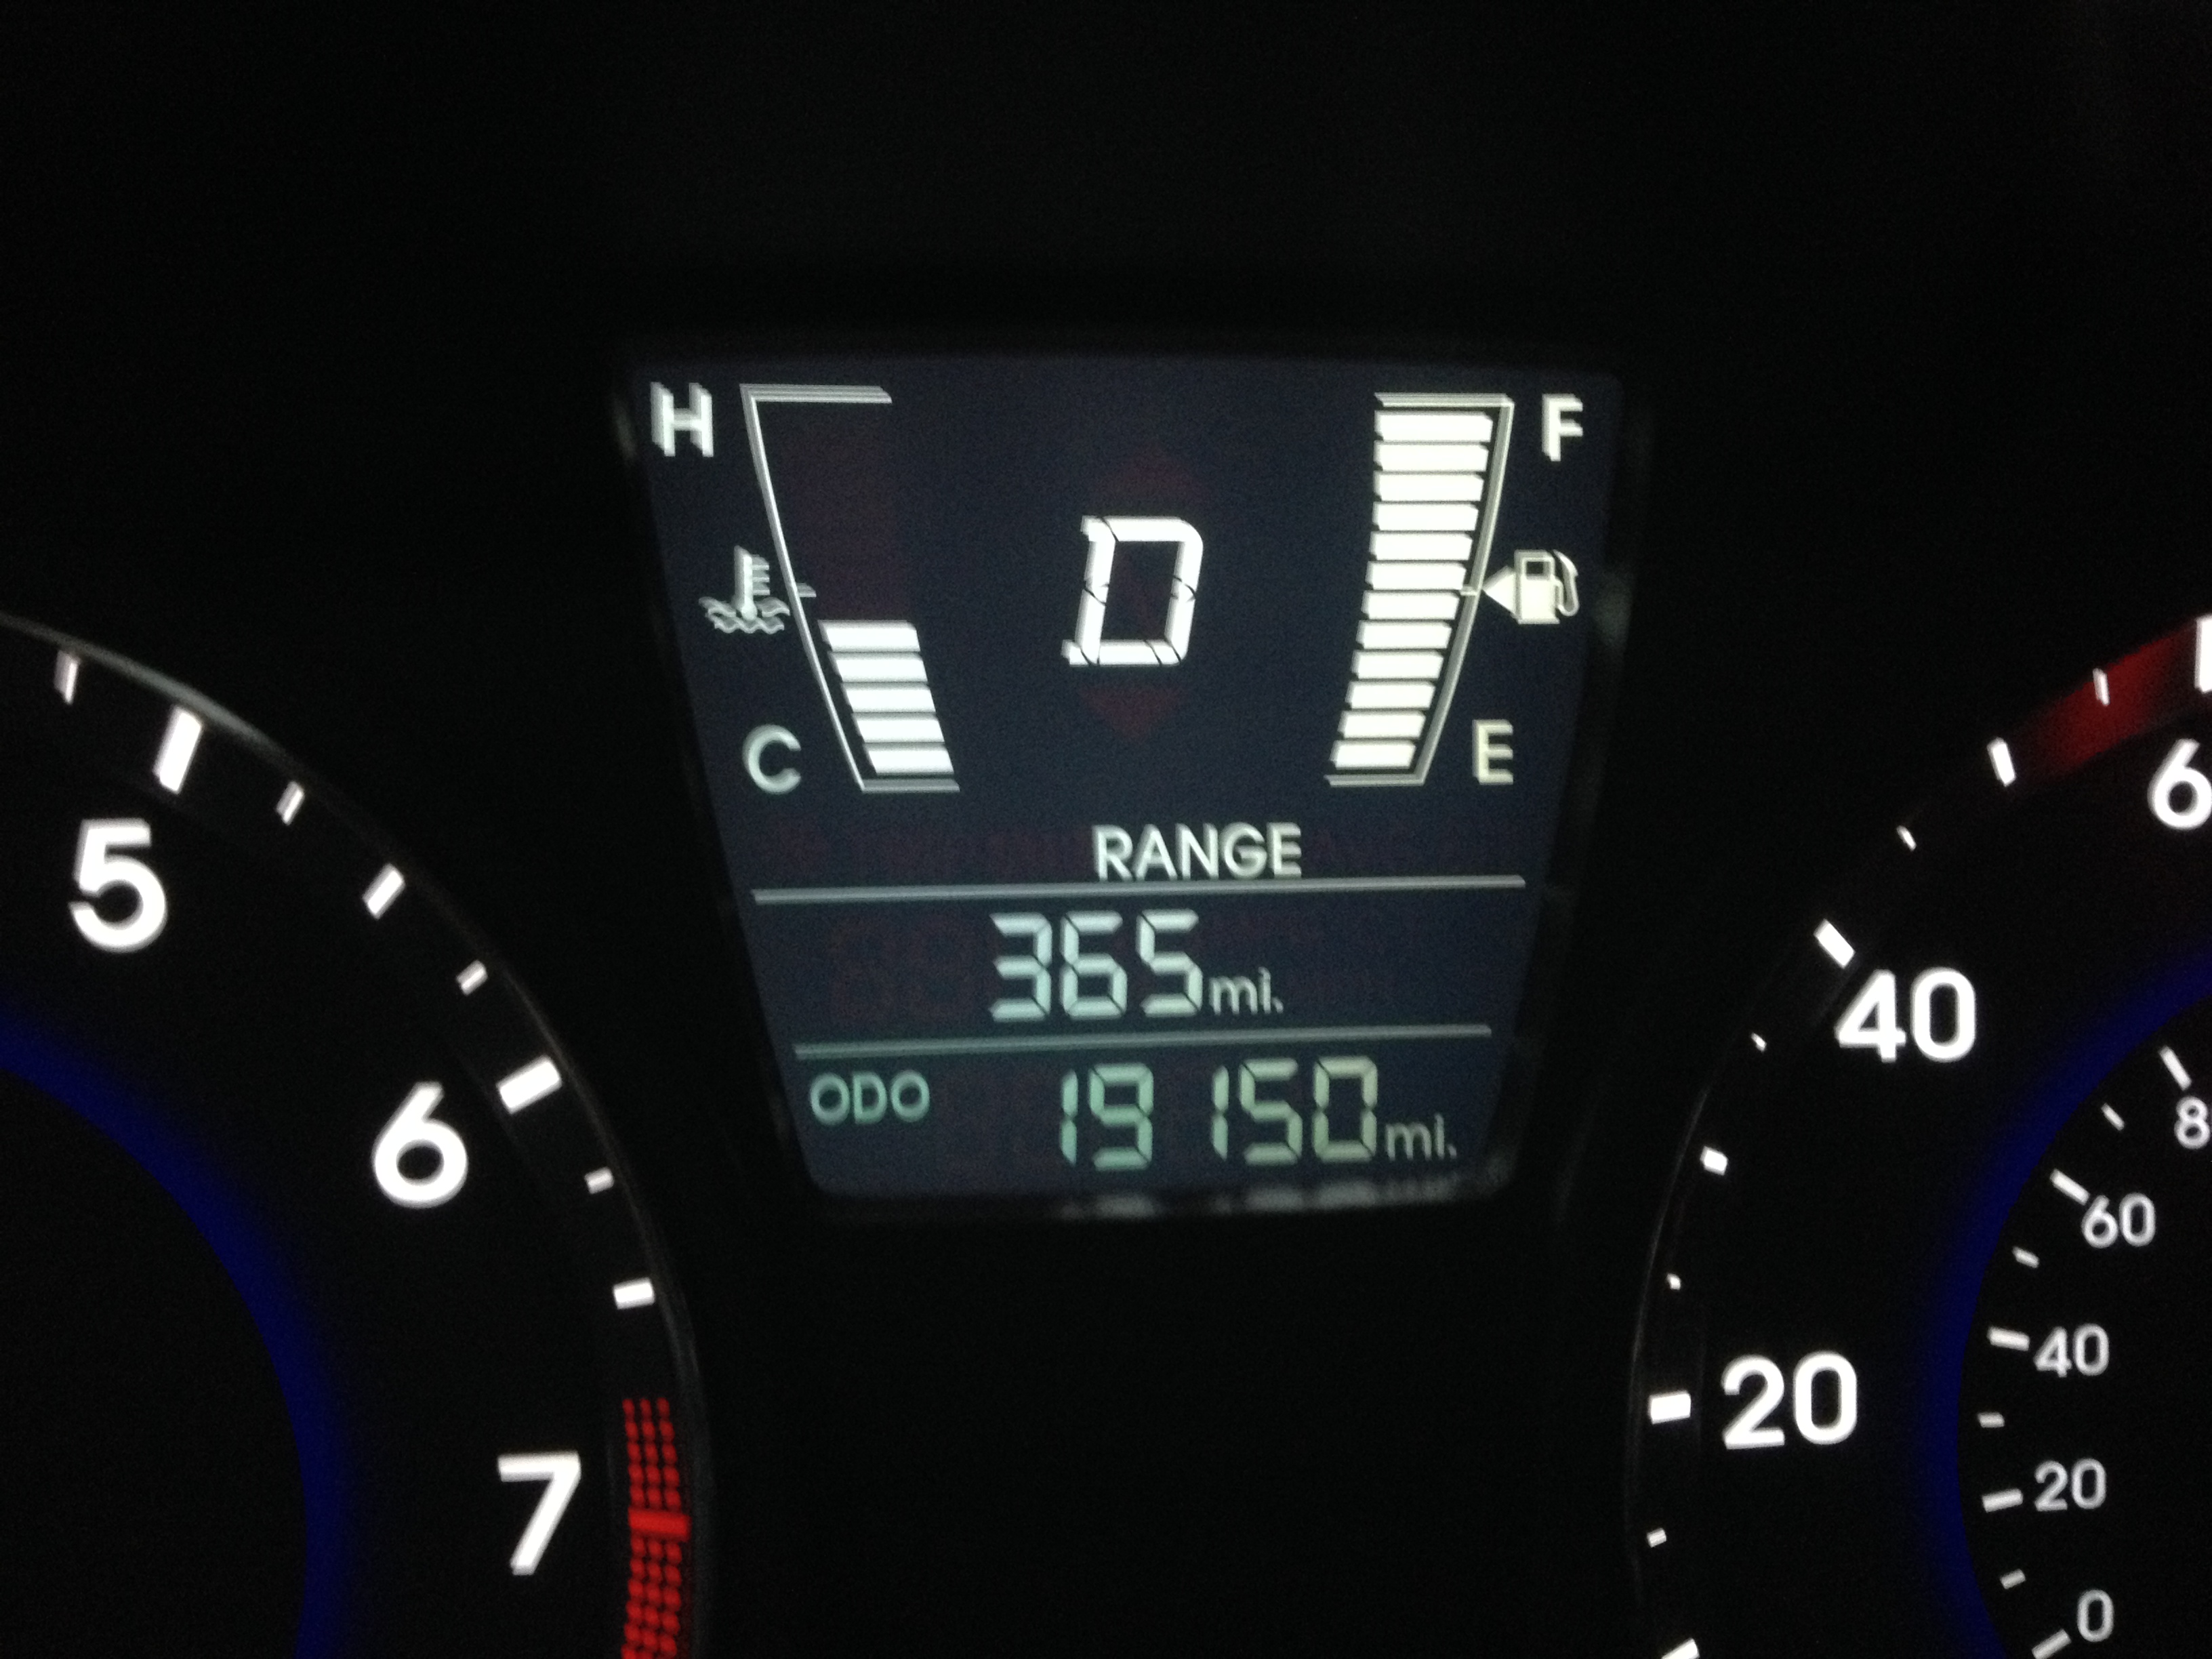
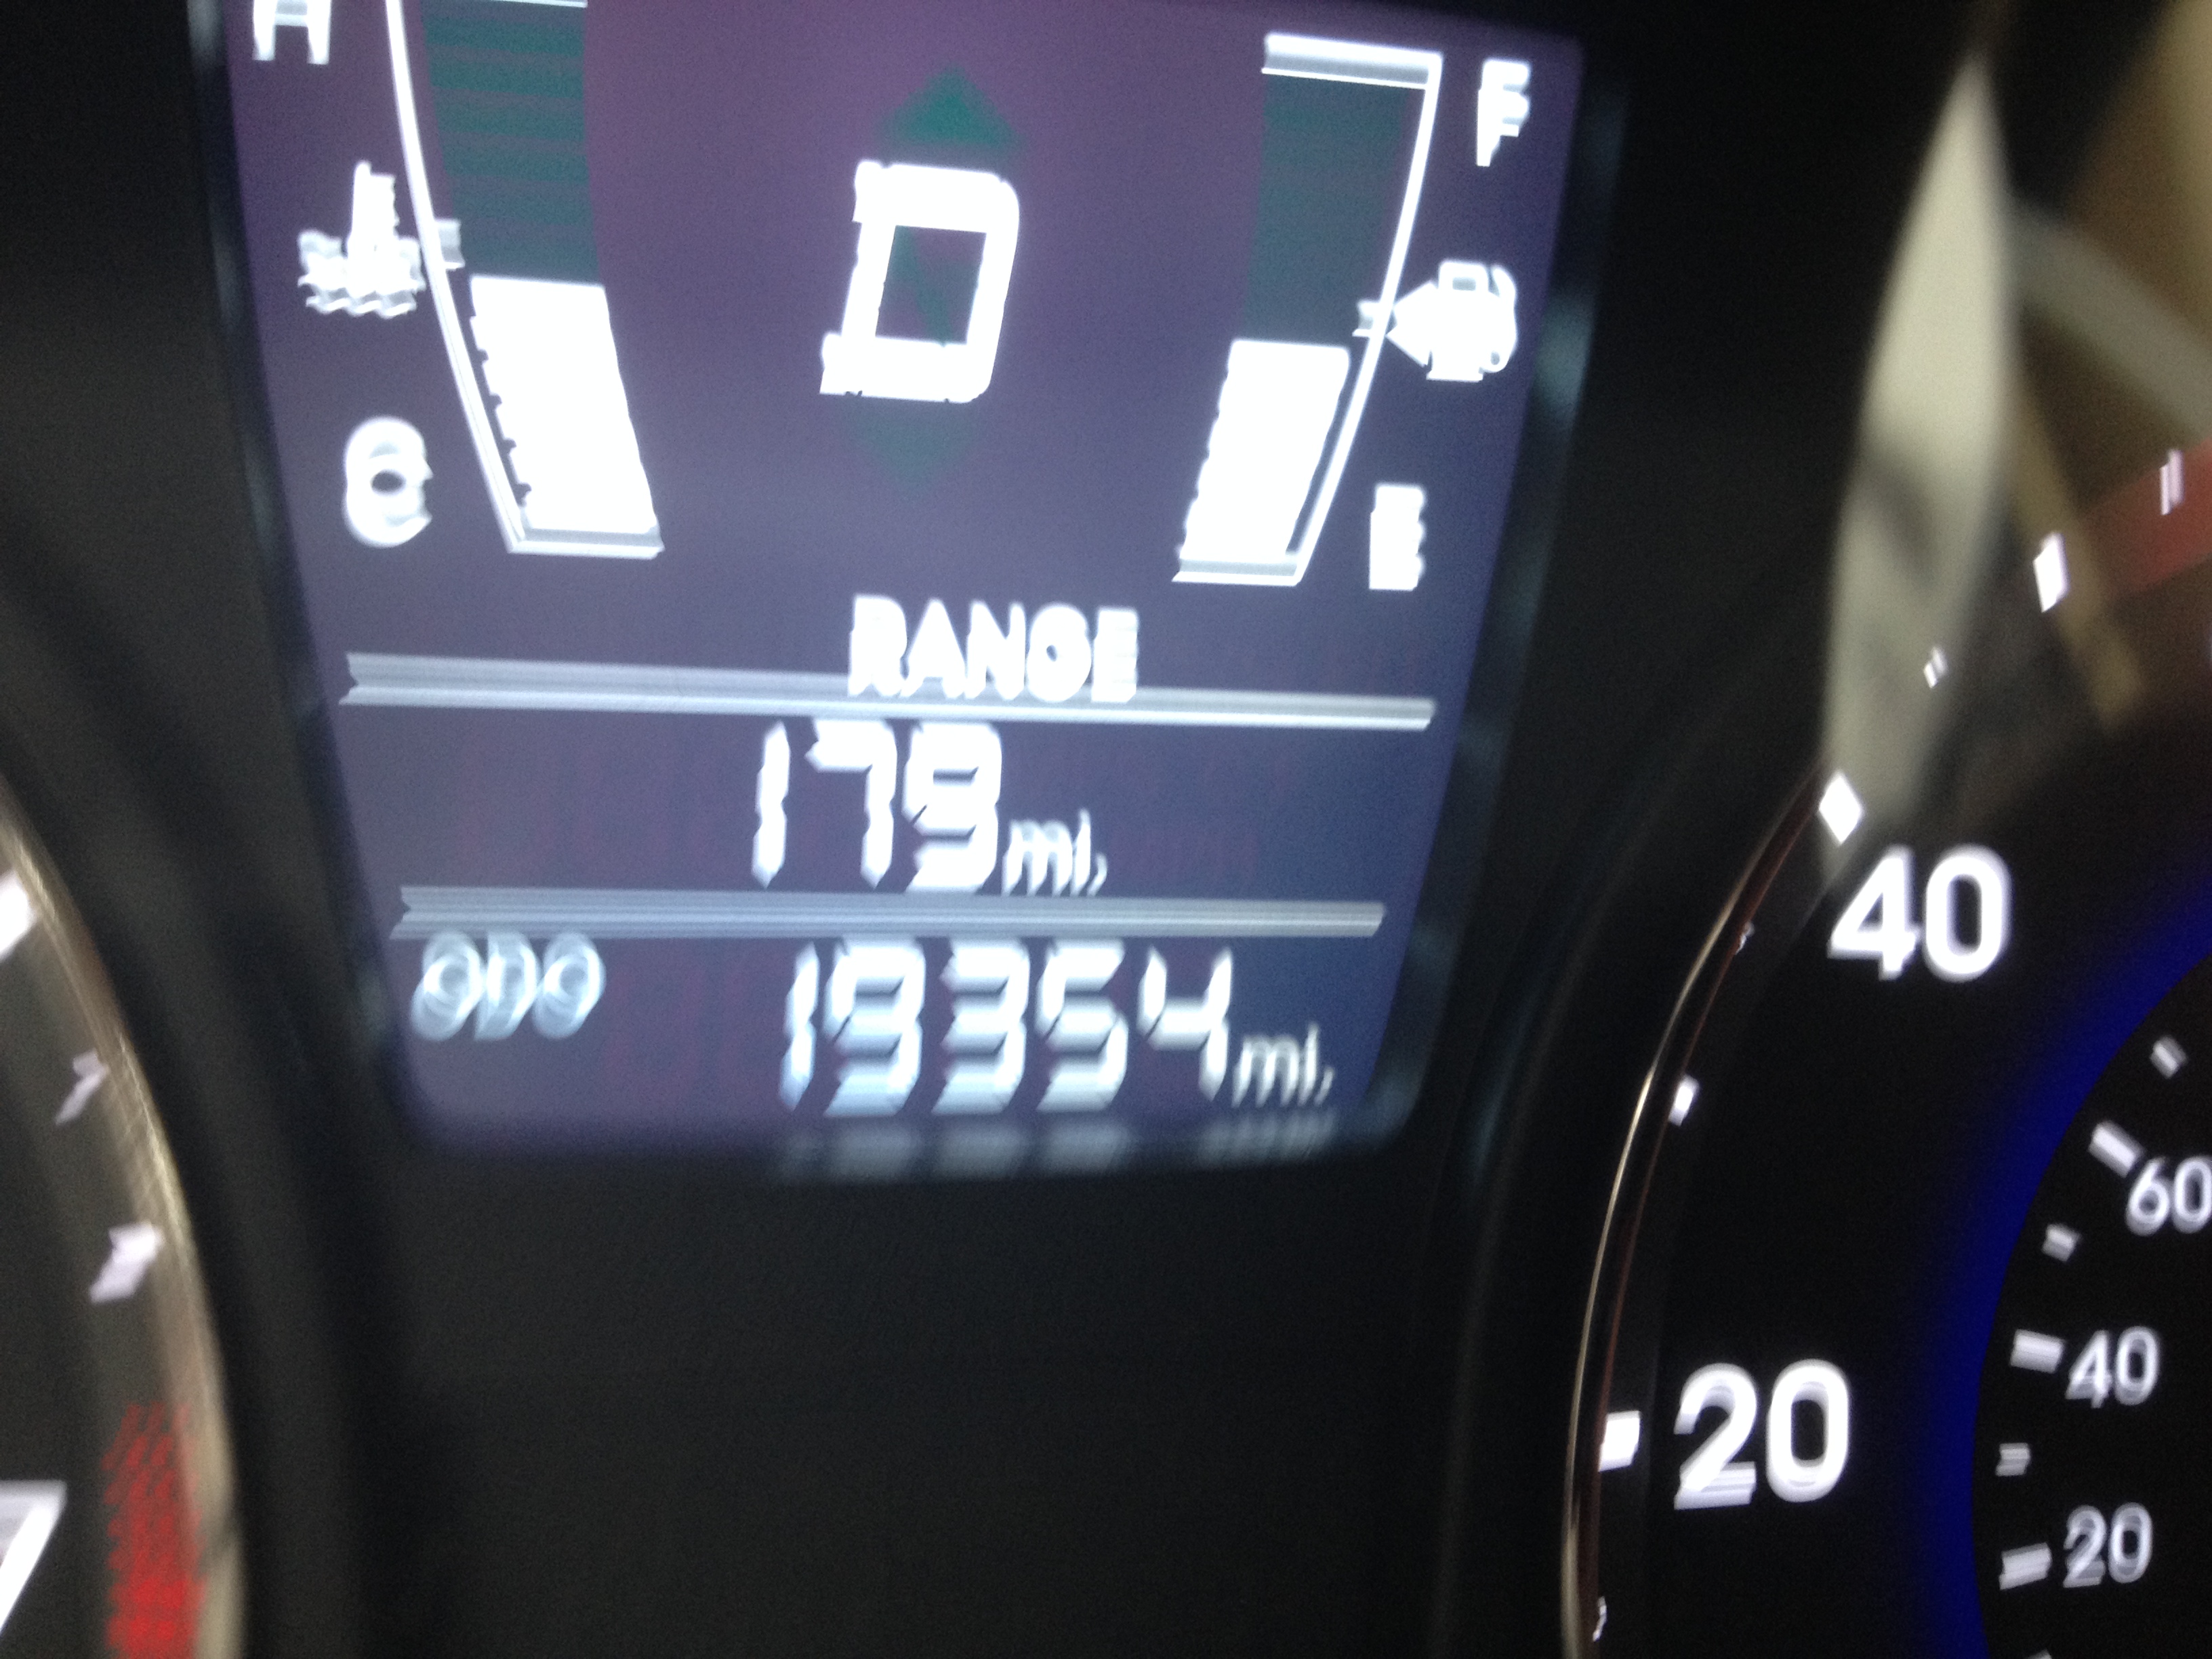
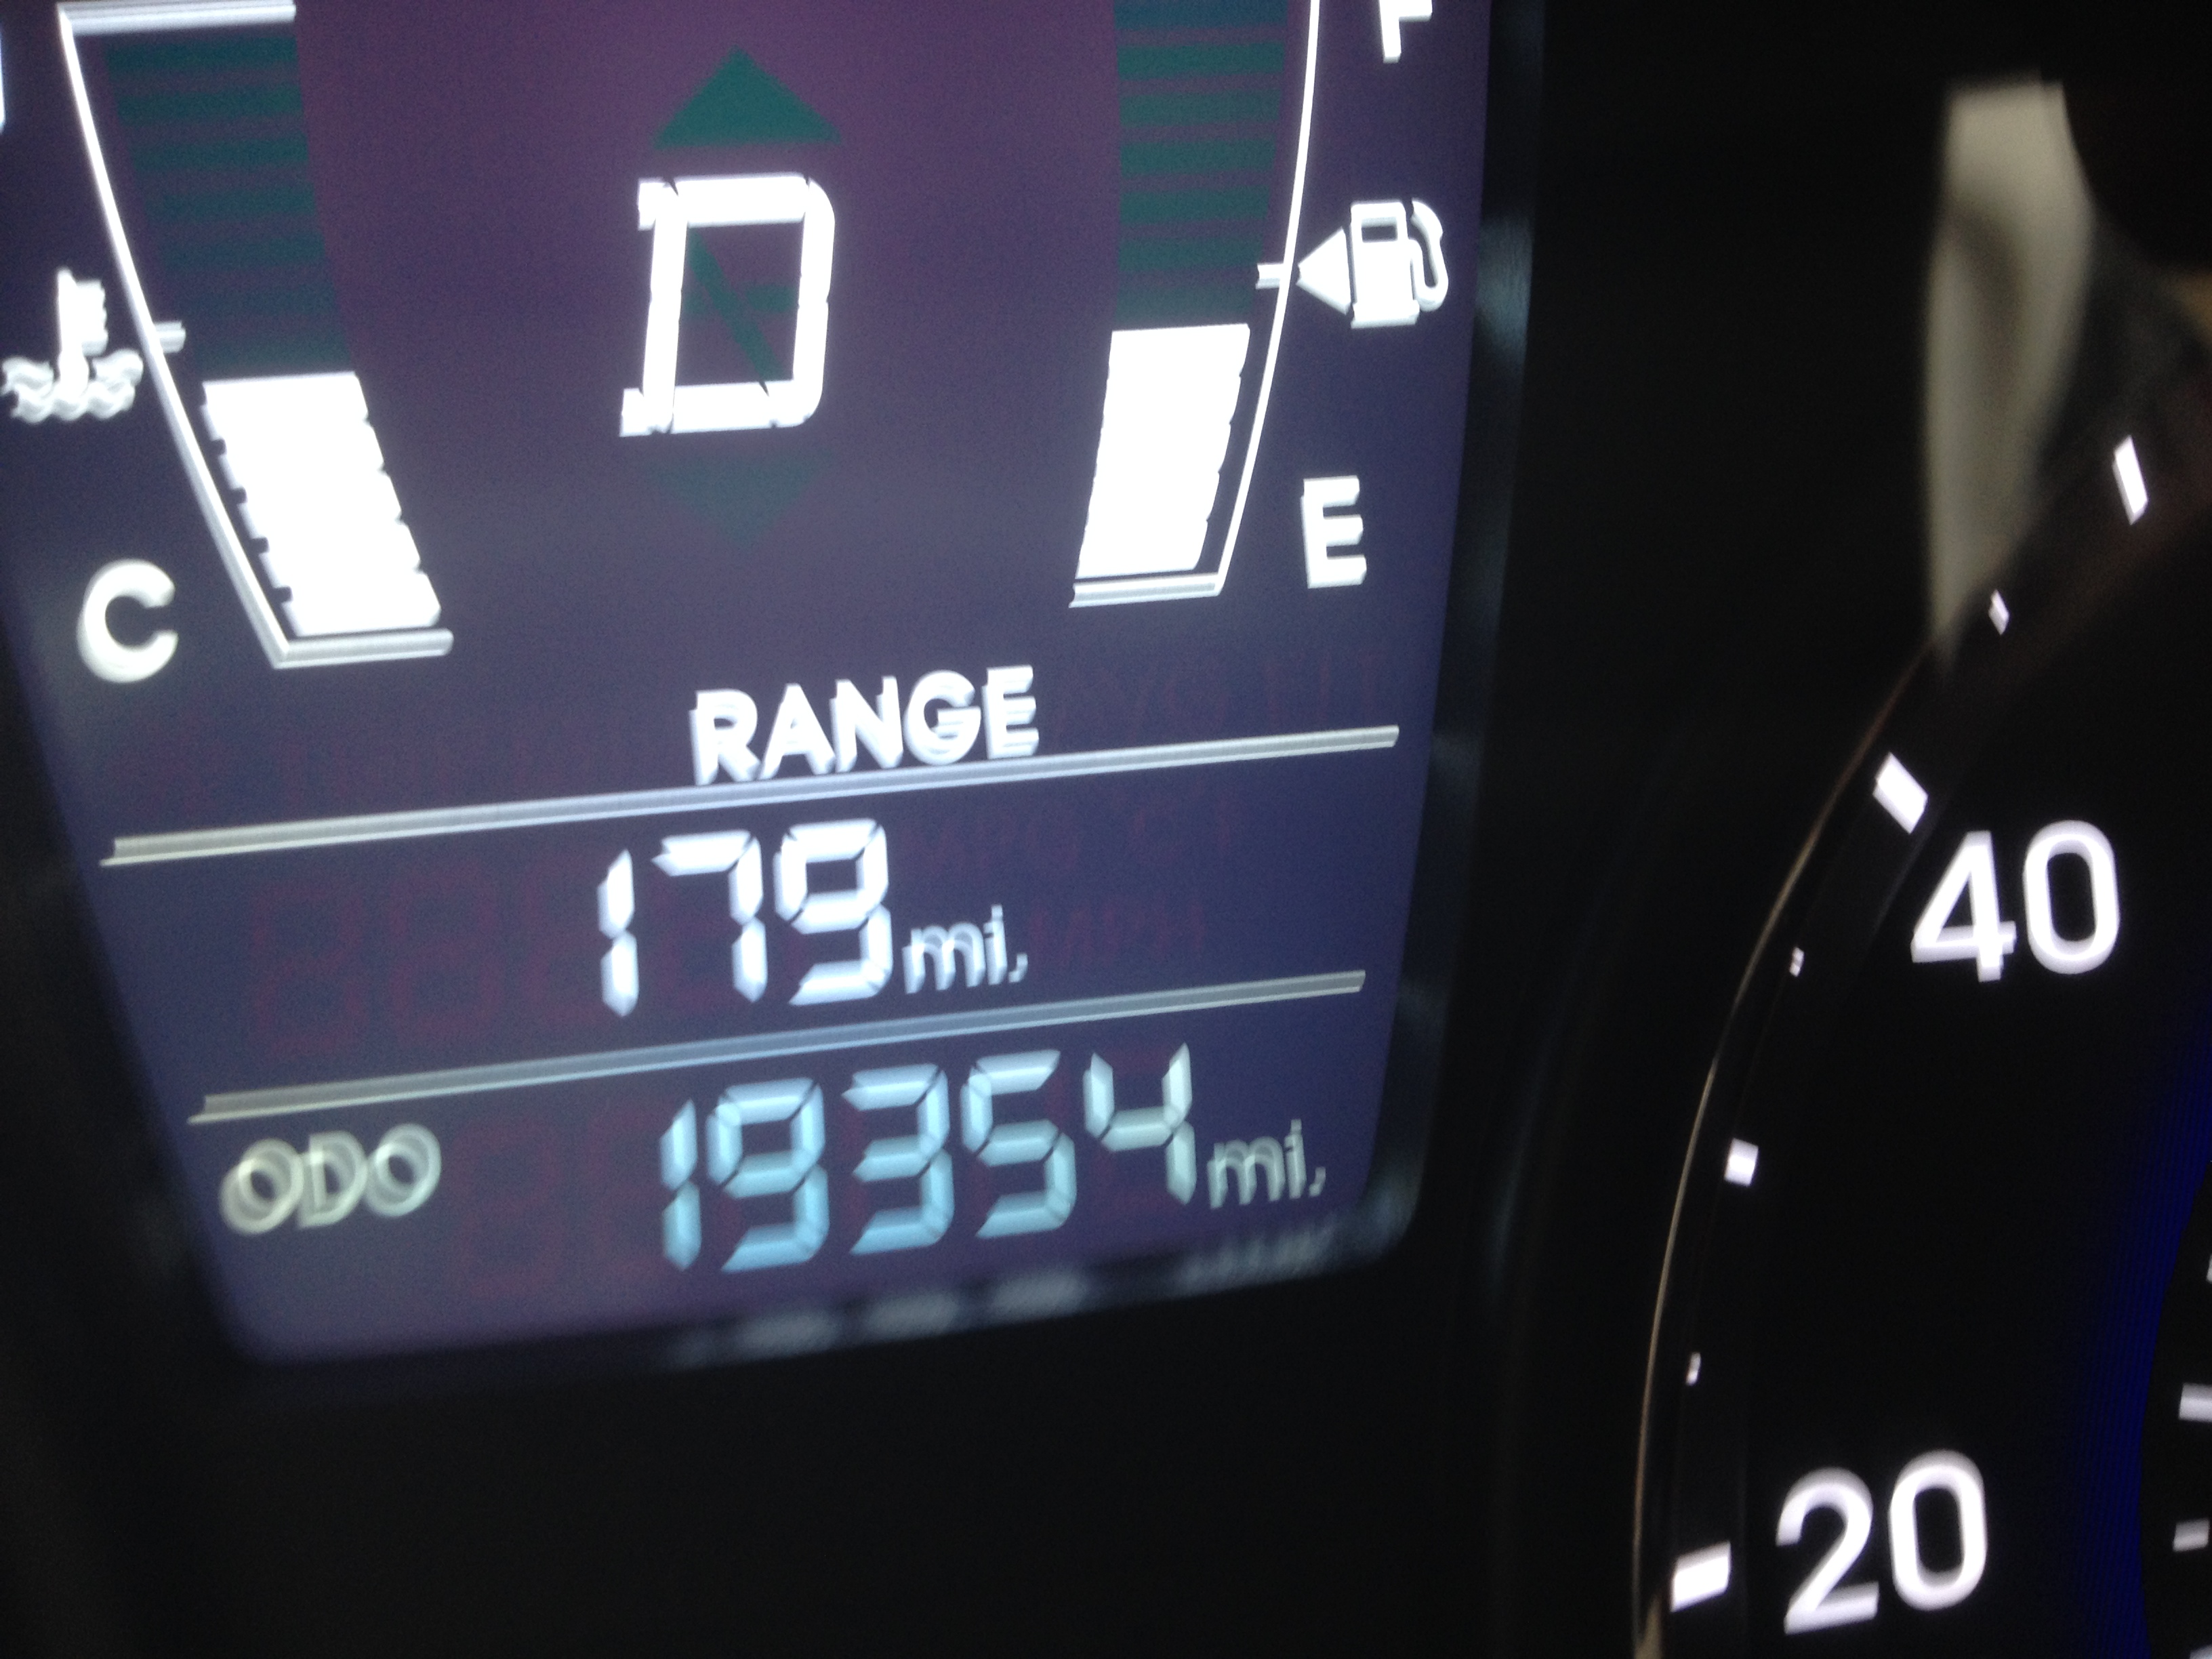
I took a significant number of photos as I drove (don’t tell my wife) and here they are.
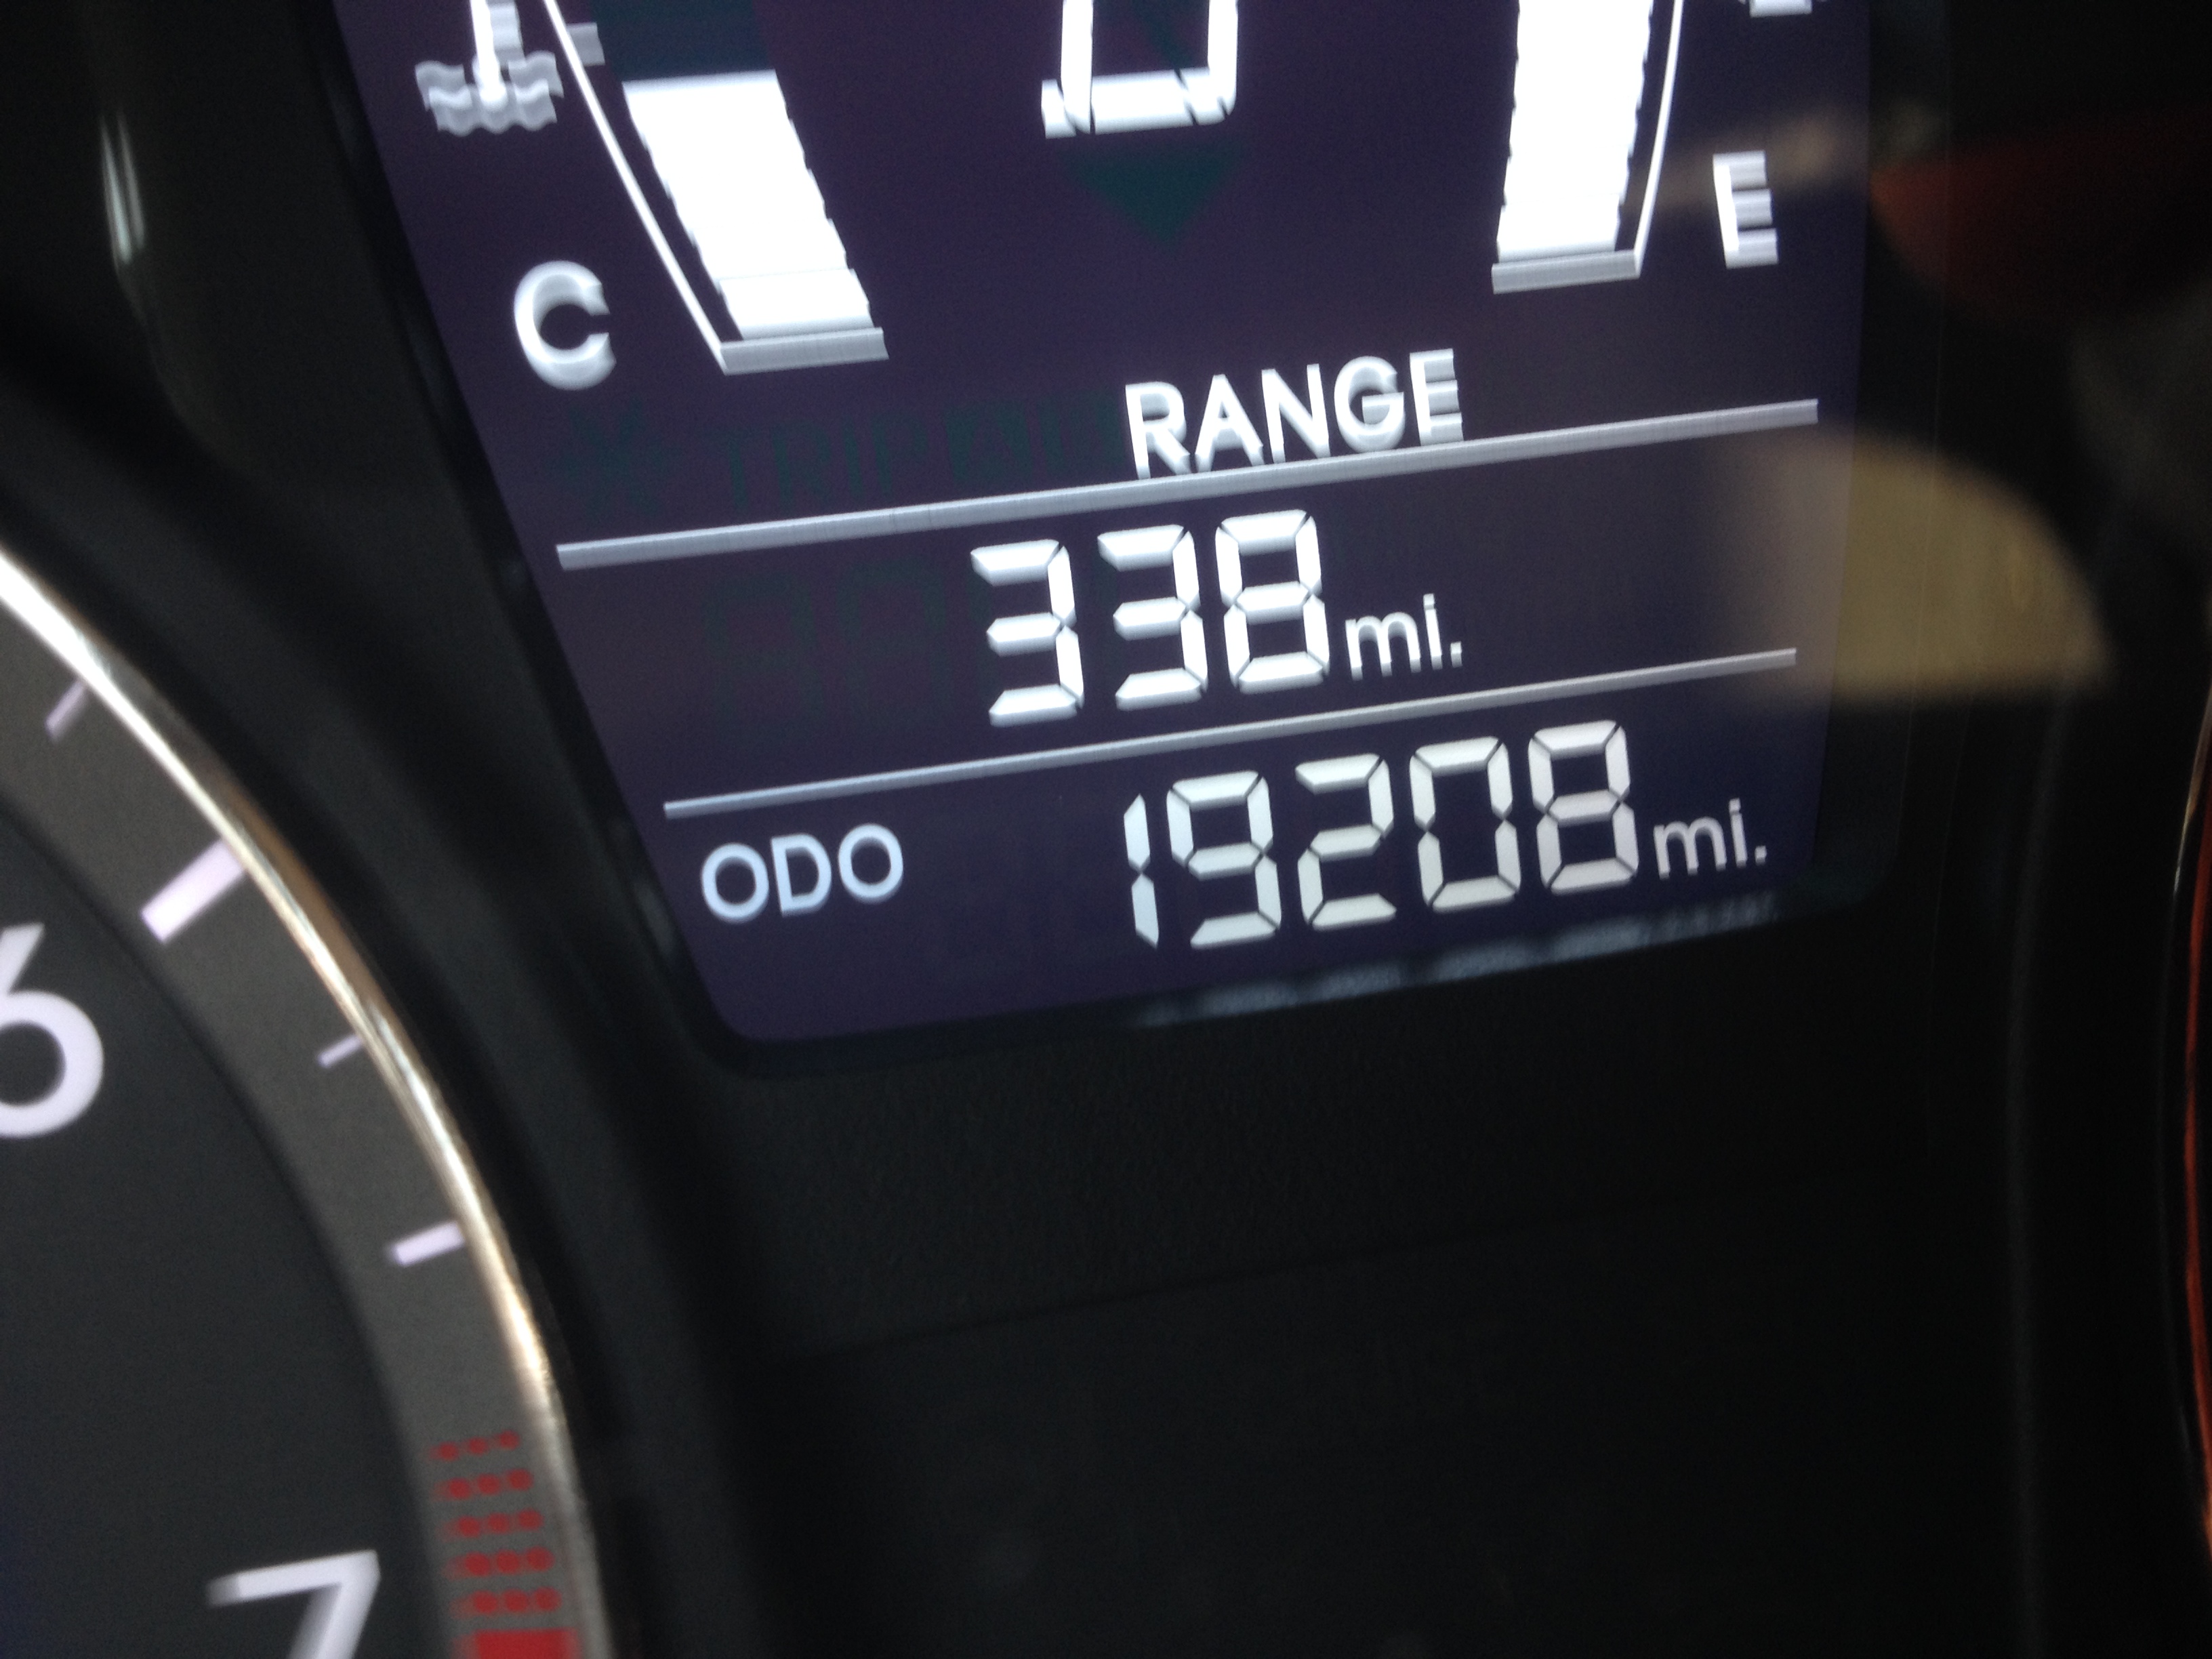
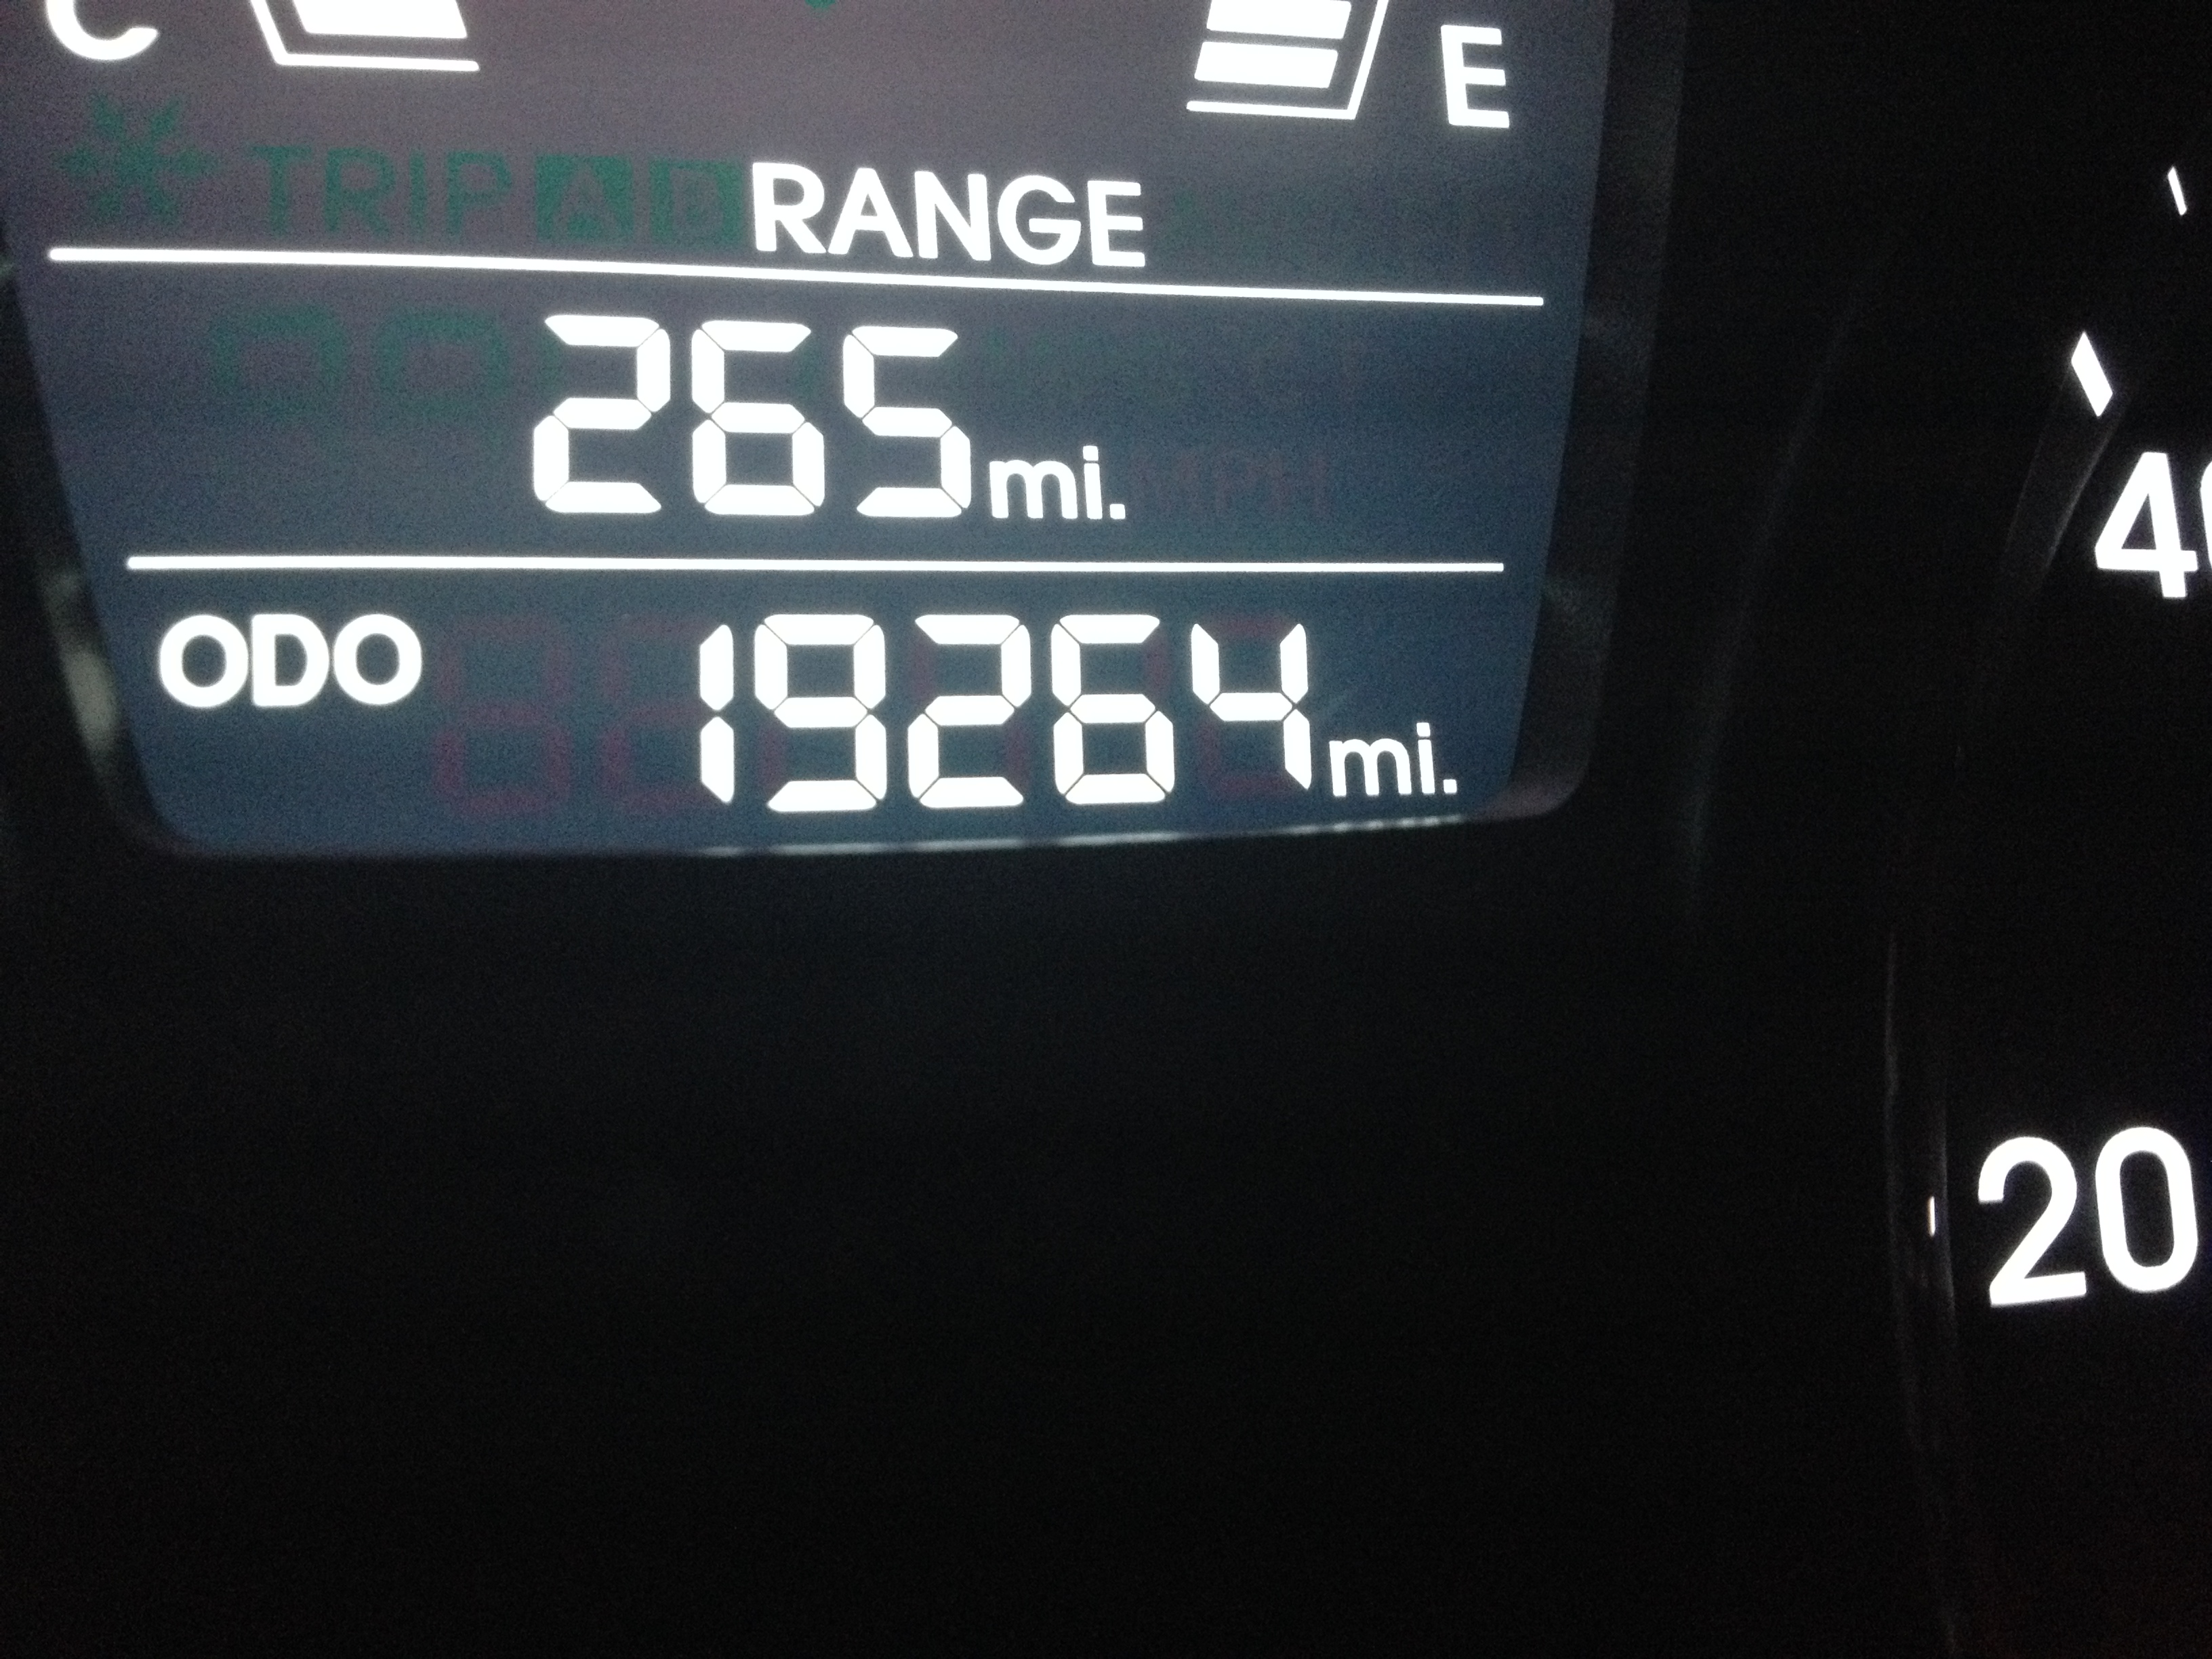


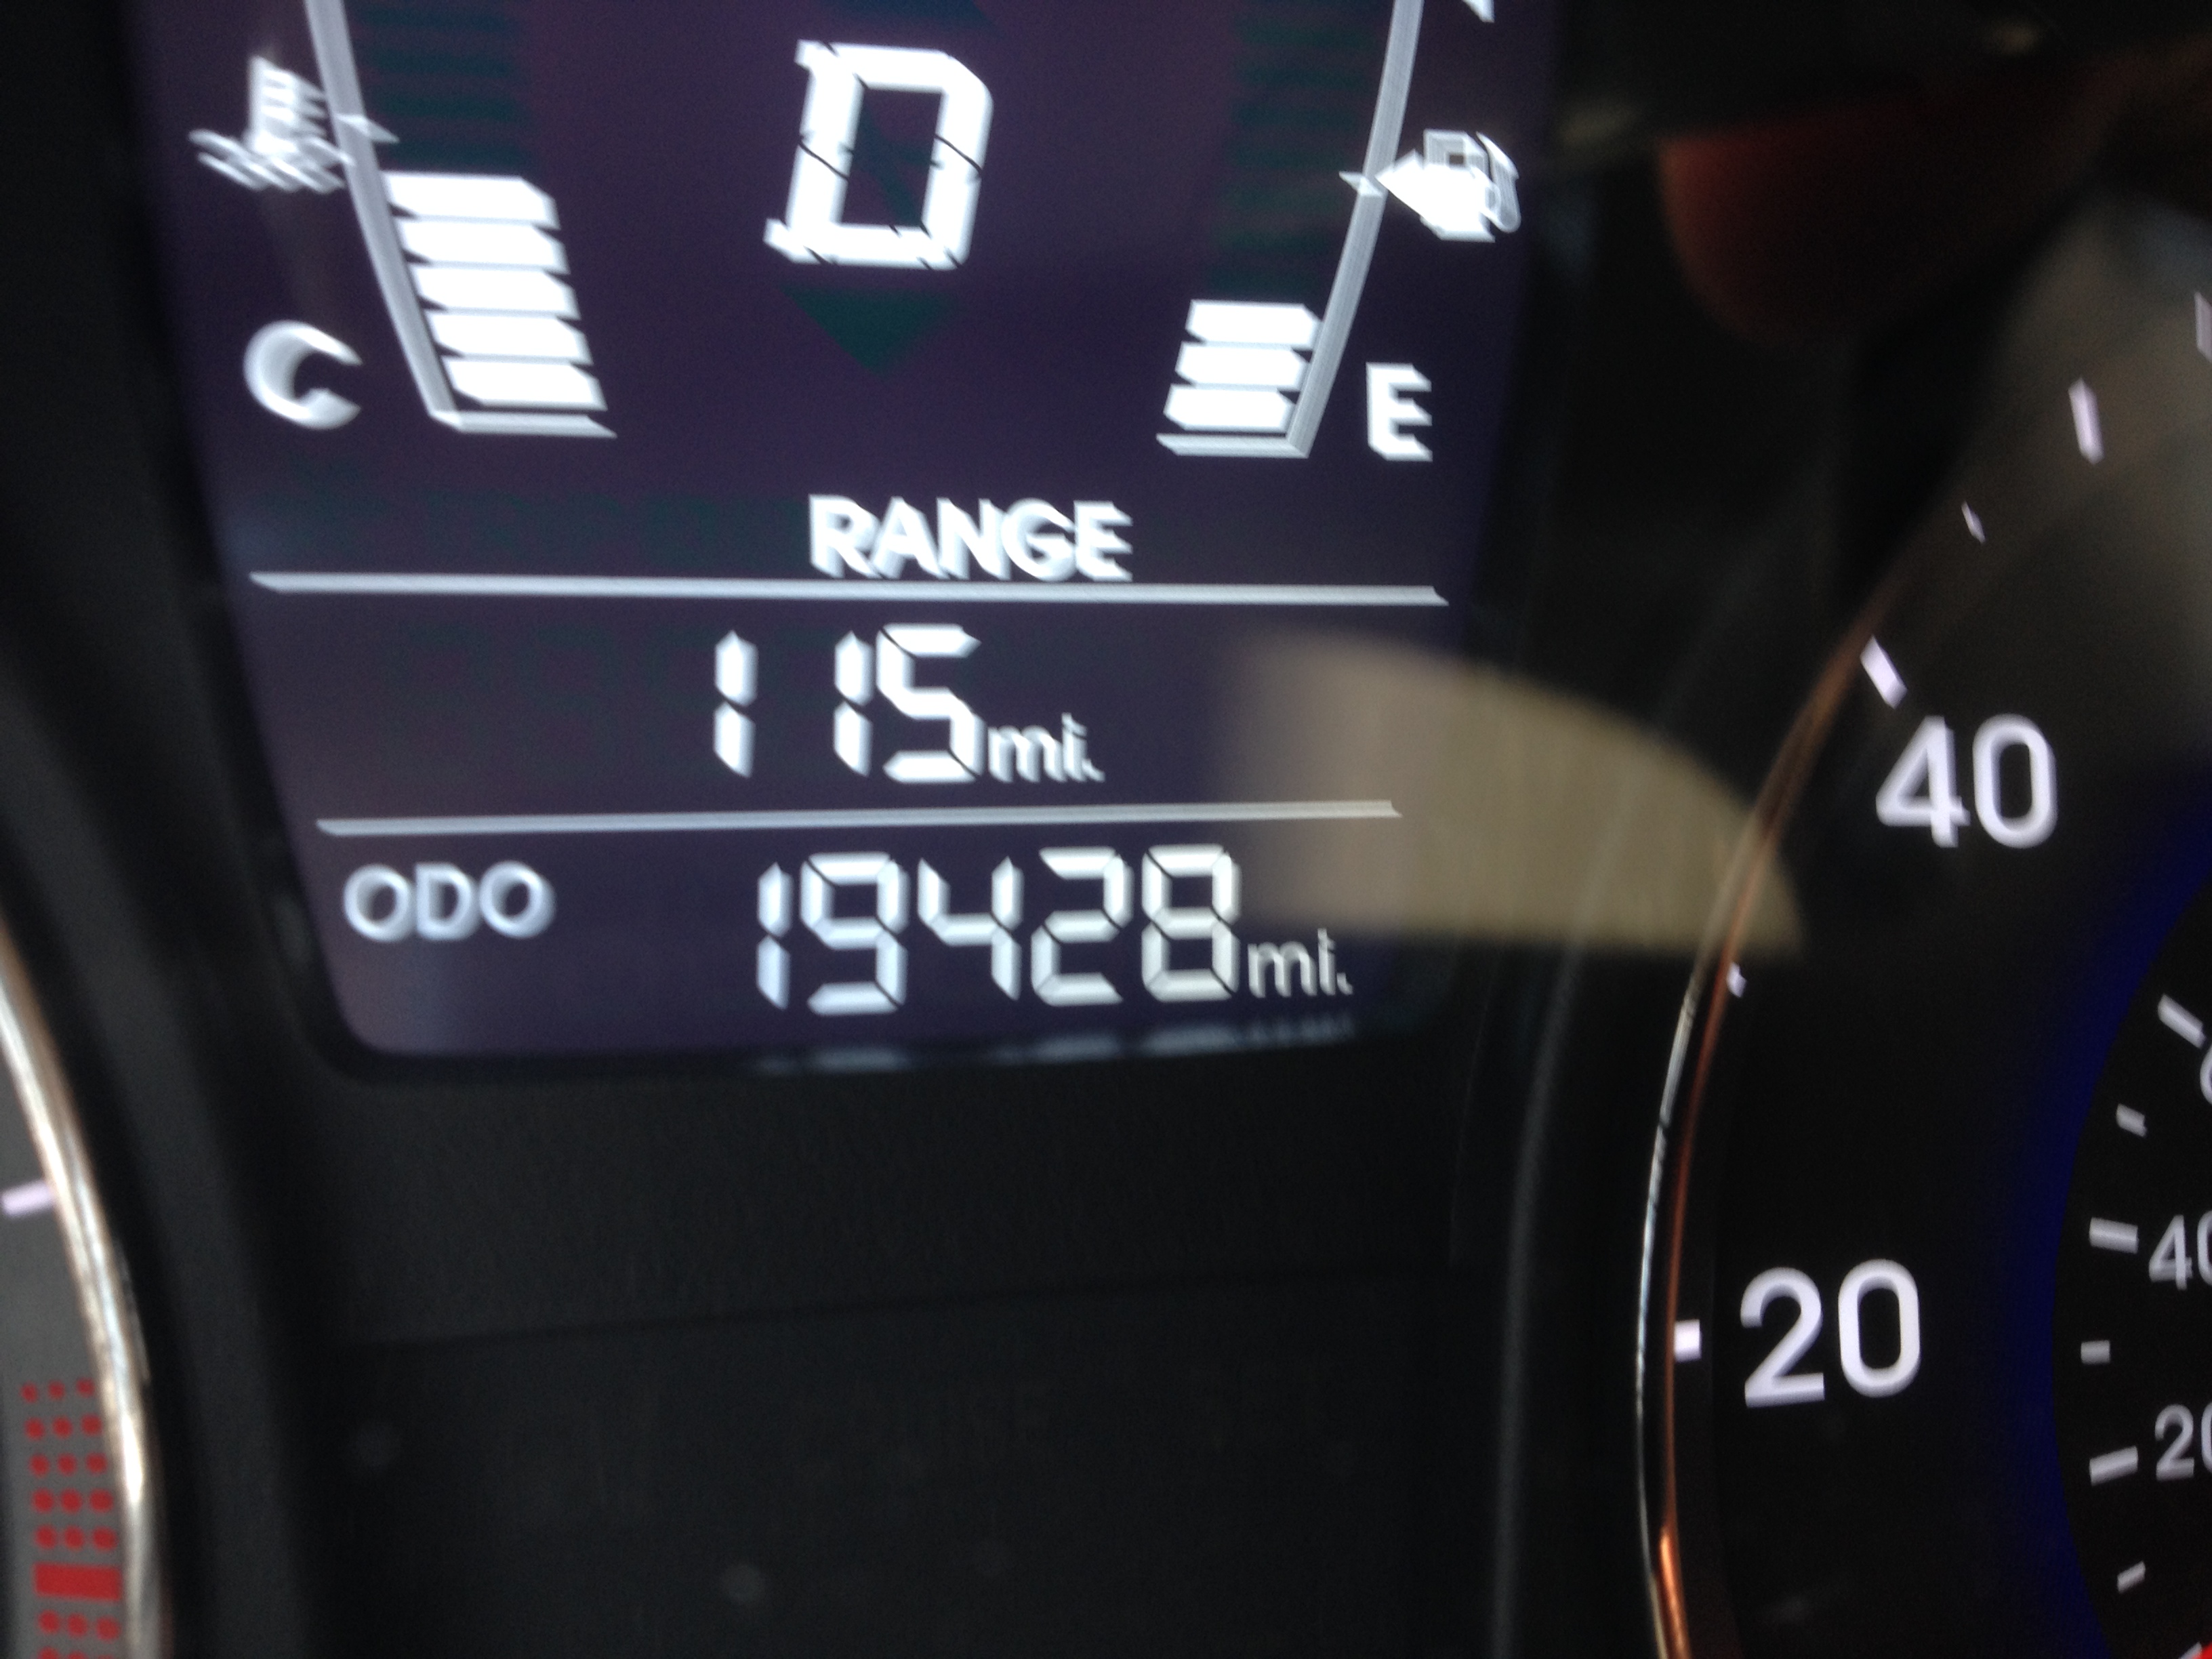
ACT 3: Running Out
After plotting the data (not while driving), how do you feel about the digital mileage readouts?

Link to Google Sheets Data file
Follow Up Question:
What’s my average gas mileage?
You beat me to this. I was thinking similar thoughts about my car’s fuel computer. I may have to do something similar to get a second data set.
Please do! I’d love to compare and see if one company is more reliable than another.